%20--%3e%3csvg%20width='63.297821mm'%20height='39.29665mm'%20viewBox='0%200%2063.297821%2039.29665'%20version='1.1'%20id='svg8765'%20inkscape:version='1.1%20(c4e8f9ed74,%202021-05-24)'%20sodipodi:docname='OBALogoSingle2.svg'%20xmlns:inkscape='http://www.inkscape.org/namespaces/inkscape'%20xmlns:sodipodi='http://sodipodi.sourceforge.net/DTD/sodipodi-0.dtd'%20xmlns='http://www.w3.org/2000/svg'%20xmlns:svg='http://www.w3.org/2000/svg'%3e%3csodipodi:namedview%20id='namedview8767'%20pagecolor='%23ffffff'%20bordercolor='%23666666'%20borderopacity='1.0'%20inkscape:pageshadow='2'%20inkscape:pageopacity='0.0'%20inkscape:pagecheckerboard='0'%20inkscape:document-units='mm'%20showgrid='false'%20fit-margin-top='0'%20fit-margin-left='0'%20fit-margin-right='0'%20fit-margin-bottom='0'%20inkscape:zoom='1.1759259'%20inkscape:cx='179.85827'%20inkscape:cy='102.04724'%20inkscape:window-width='1920'%20inkscape:window-height='972'%20inkscape:window-x='0'%20inkscape:window-y='27'%20inkscape:window-maximized='1'%20inkscape:current-layer='layer1'%20/%3e%3cdefs%20id='defs8762'%20/%3e%3cg%20inkscape:label='Layer%201'%20inkscape:groupmode='layer'%20id='layer1'%20transform='translate(-31.351095,-50.101677)'%3e%3cpath%20style='fill:none;stroke:%233584e4;stroke-width:3.965;stroke-linecap:square;stroke-linejoin:round;stroke-miterlimit:4;stroke-dasharray:none;stroke-opacity:1'%20d='m%2077.07508,77.78787%2014.84134,8.87817%20V%2052.83397%20L%2034.08359,86.5521%20V%2053.69366%20l%2015.27351,9.31107'%20id='path8388'%20sodipodi:nodetypes='cccccc'%20/%3e%3c/g%3e%3c/svg%3e)
Best Financial Analysis Software for Investors (2026)
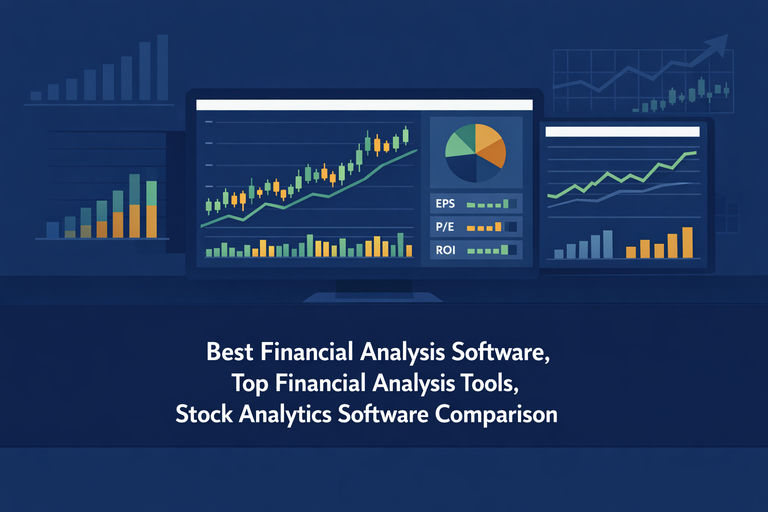
Explore the best financial analysis software available today, from institutional platforms like Bloomberg to accessible tools like Koyfin and Morningstar. Learn which financial analysis tools suit your investment style and how to build a practical analytical toolkit.
On this page (17)
Choosing the right financial analysis software can be the difference between making well-informed investment decisions and flying blind in a complex market. Whether you're evaluating a company's balance sheet, tracking earnings trends, or comparing valuation multiples across sectors, the tools you use shape the quality of your analysis. This guide cuts through the noise to help you understand what separates genuinely useful financial analysis tools from the rest — and how to match the right software to your specific investment workflow.
What Makes Financial Analysis Software Worth Using?
Not all financial data analysis software is created equal. Some platforms are built for professional fund managers running complex models; others are designed for retail investors who want clean, accessible data without a steep learning curve. Before comparing specific tools, it helps to understand the core capabilities that define a high-quality platform.
- Data depth and accuracy: The foundation of any good tool is reliable, up-to-date financial data — income statements, balance sheets, cash flow statements, and key ratios going back at least ten years.
- Analytical flexibility: Can you build custom models, apply your own filters, or export data for further analysis? Rigid platforms limit serious investors.
- Visualization and usability: Charts, dashboards, and intuitive layouts matter. Dense data is only useful if you can interpret it quickly and clearly.
- Coverage breadth: Does the platform cover domestic and international equities, ETFs, and fixed income? Narrow coverage creates blind spots.
- Integration capability: For more advanced users, the ability to connect with spreadsheets, APIs, or portfolio management tools adds significant value.
With these criteria in mind, let's look at the major categories of stock analytics software and what each type does best.
Categories of Financial Analysis Tools
The landscape of financial analysis tools spans several distinct categories, each serving a different analytical purpose. Understanding these categories helps you build a toolkit rather than searching for a single platform that does everything adequately but nothing exceptionally well.
Fundamental Analysis Platforms
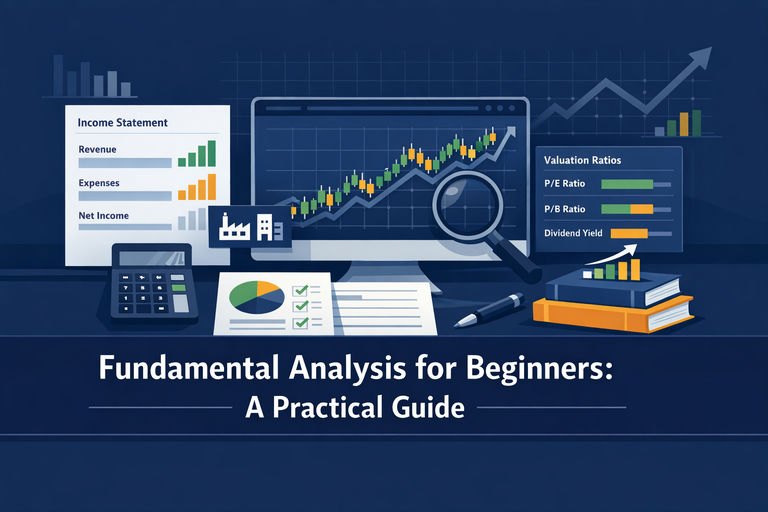
These tools focus on a company's financial health — revenue growth, profit margins, debt levels, return on equity, and valuation metrics like price-to-earnings (P/E) and enterprise value-to-EBITDA. Platforms in this category pull directly from SEC filings and earnings reports, normalizing data so you can make apples-to-apples comparisons across companies and sectors. For long-term investors, this is typically the most important category of financial analysis software.
Technical Analysis and Charting Tools
Technical analysis software focuses on price action, volume, and momentum indicators rather than underlying financials. These platforms are built around interactive charts, drawing tools, and pattern recognition. They're most commonly used by active traders and short-term investors who prioritize timing over valuation. While technical tools have their place, they're generally less relevant for investors focused on business fundamentals.
Portfolio Analytics and Risk Tools
These platforms analyze a portfolio as a whole rather than individual securities. They measure diversification, factor exposure, correlation between holdings, and risk-adjusted returns. For investors managing a multi-asset portfolio, this category of stock analytics tools provides a layer of insight that single-stock analysis platforms simply can't offer.
Data Aggregation and Research Platforms
Some of the most powerful tools in the market are essentially sophisticated data aggregators — pulling together financial statements, analyst estimates, news, transcripts, and alternative data into a single interface. These platforms are often used by institutional investors and professional analysts, though several have introduced more accessible tiers for serious retail investors.
Leading Financial Analysis Software: A Practical Comparison
Rather than ranking tools by a single score, it's more useful to understand what each platform does well and where it falls short. Here's a practical look at some of the most widely used best financial analysis software options available today.
Bloomberg Terminal
Bloomberg Terminal remains the gold standard for institutional financial analysis. It offers unmatched data breadth — covering equities, fixed income, commodities, currencies, and derivatives — alongside real-time news, analytics, and communication tools. The platform's analytical depth is extraordinary, but so is its cost, which puts it out of reach for most individual investors. For professionals at asset management firms or investment banks, it's often considered essential infrastructure rather than optional software.
FactSet
FactSet is a direct competitor to Bloomberg in the institutional space, with particular strength in fundamental data, earnings estimates, and portfolio analytics. Many buy-side analysts prefer FactSet's interface for building financial models and running sector comparisons. Like Bloomberg, it's priced for institutional use, but it's worth understanding what it offers because many of its core capabilities have trickled down into more accessible platforms.
Morningstar Direct and Morningstar Investor
Morningstar occupies an interesting middle ground. Its institutional product, Morningstar Direct, is a comprehensive research and analytics platform used by asset managers and advisors. Its consumer-facing product, Morningstar Investor, brings a meaningful subset of that capability to individual investors at a fraction of the cost. Morningstar's proprietary fair value estimates and economic moat ratings are particularly well-regarded among fundamental investors. Companies like Johnson & Johnson (JNJ) and Berkshire Hathaway (BRK.B) are examples of widely covered names where Morningstar's qualitative research adds real depth beyond raw numbers.
Koyfin
Koyfin has emerged as one of the most compelling financial data analysis software options for serious retail investors and independent analysts. It offers institutional-quality charting and fundamental data — including income statements, balance sheets, cash flow, and key ratios — with a clean, modern interface. Its macro dashboards and earnings analysis tools are particularly strong. Koyfin has positioned itself as a more accessible alternative to Bloomberg for investors who need depth without the enterprise price tag.
Visible Alpha
Visible Alpha specializes in consensus estimates, breaking down analyst models at a granular level — line-item revenue forecasts, margin assumptions, and segment-level projections. For investors who want to understand not just what analysts expect, but why, and where the variance lies, this is a uniquely valuable tool. It's particularly useful when analyzing companies with complex business structures, such as Alphabet (GOOGL) or Amazon (AMZN), where segment performance drives the overall investment thesis.
Simply Wall St
Simply Wall St takes a visualization-first approach to stock analytics software, presenting financial data through intuitive infographics and snowflake charts that summarize a company's valuation, financial health, dividends, and growth in a single view. It's designed for investors who want to quickly assess a company's overall profile without building detailed models. While it lacks the raw data depth of Bloomberg or FactSet, it excels at making complex financial information digestible.
Try it free
Financial analysis without the spreadsheet work
Openbook distils 16 financial metrics per company into four factor scores and two headline ratings, across 25,000+ equities and ETFs — with every underlying driver visible.
What to Look for in Share Analysis Tools for Different Investor Types
The right share analysis tools depend heavily on your investment style, time horizon, and analytical depth. Here's a practical framework for matching tools to investor profiles.
- Long-term value investors: Prioritize platforms with deep historical fundamental data, valuation metrics, and qualitative research. Morningstar, Koyfin, and platforms with strong DCF modeling capabilities are well-suited here.
- Growth investors: Look for tools that emphasize revenue growth trends, earnings estimate revisions, and forward-looking metrics. Visible Alpha and FactSet's estimate tools are particularly relevant.
- Income investors: Dividend history, payout ratios, and yield analysis are essential. Several platforms offer dedicated dividend tracking dashboards that make it easy to assess sustainability and growth.
- Active traders: Technical charting tools with real-time data, level 2 quotes, and momentum indicators take priority. This is a different category from fundamental analysis software and serves a distinct purpose.
- Independent analysts and researchers: Data export capabilities, API access, and model-building flexibility matter most. Platforms that allow you to pull raw data into Excel or Python environments significantly extend analytical capability.
The Role of AI and Automation in Modern Financial Analysis Software
Artificial intelligence is reshaping what financial analysis software can do. Natural language processing tools now allow investors to query financial data conversationally, summarize earnings call transcripts, and flag anomalies in financial statements automatically. Machine learning models are being applied to identify patterns in historical data that would be impractical to detect manually.
Several platforms have begun integrating AI-assisted features — automated earnings summaries, sentiment analysis on news and filings, and predictive financial modeling. While these capabilities are still maturing, they represent a meaningful shift in how investors can interact with large volumes of financial data. The key distinction to keep in mind is that AI tools in this context are analytical aids, not decision-makers. They surface information and patterns; the judgment about what those patterns mean for an investment thesis still belongs to the analyst.
For investors evaluating stock analytics tools today, it's worth asking whether a platform's AI features genuinely improve analytical output or simply add a layer of automation to tasks that were already straightforward. The most valuable AI integrations tend to be those that save time on data gathering and normalization, freeing up more time for the higher-order thinking that actually drives investment decisions.
No card required
Assemble the toolkit for nothing
Screening, portfolio analytics and dividend tracking are all on the free plan, with no trial clock. A reasonable place to start before paying for anything.
Building a Practical Financial Analysis Toolkit
Most serious investors don't rely on a single platform. Instead, they build a layered toolkit where different tools serve different purposes. A practical approach might combine a fundamental data platform for financial statement analysis, a charting tool for price and volume context, a portfolio analytics tool for risk monitoring, and a news aggregator for staying current on company and sector developments.
The goal isn't to use the most tools — it's to use the right tools efficiently. Overlapping capabilities across multiple platforms create noise rather than insight. When evaluating any new piece of financial analysis software, the most useful question is: does this help me answer a specific analytical question that I currently can't answer well? If the answer is yes, it earns a place in the toolkit. If it duplicates what you already have, it's probably not worth the additional cost or complexity.
Conclusion: Choosing the Right Financial Analysis Software for Your Needs
The market for financial analysis tools has never been more competitive or more capable. Institutional-grade data and analytics that once required a Bloomberg Terminal subscription are increasingly available through more accessible platforms, narrowing the information gap between professional and individual investors. The best approach is to start with a clear understanding of your investment process — what questions you're trying to answer, what data you need to answer them, and how much time you're willing to invest in learning a new platform. From there, matching the right stock analytics software to your workflow becomes a much more tractable problem. The tools covered in this guide represent some of the strongest options available across different use cases and budget levels, but the right choice ultimately depends on how you invest and what you're trying to learn.
Next step
Put the software to work on a real shortlist
Analysis tools earn their keep at the discovery stage. Rank the universe on fundamentals first, then read the financials on the handful that survive.
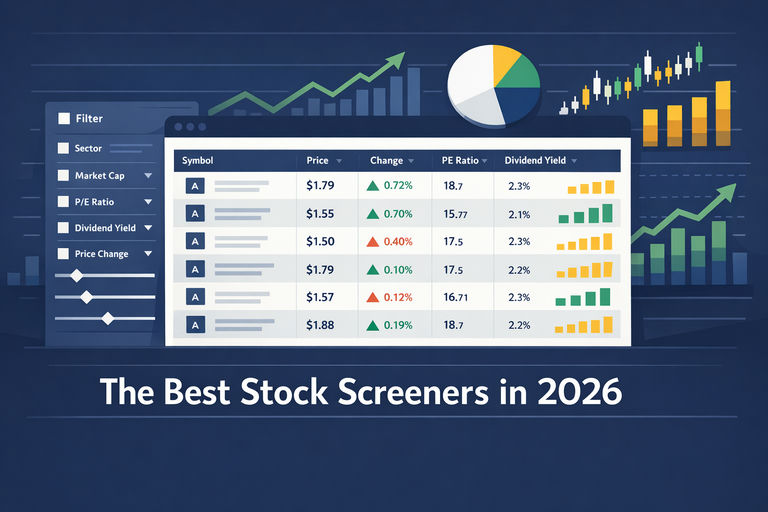
You can Compare JNJ, GOOGL, AMZN side by side on Openbook, or find stocks with the screener.
Related analysis

Co-founder of Openbook Analytics. Andrew studied Finance and Economics at the University of Strathclyde and writes on UK & US equities, stock valuation models, and portfolio strategy.
This article is for information and education only. It is not investment advice and not a recommendation to buy, sell or hold any investment. Openbook Analytics Ltd is not authorised or regulated by the Financial Conduct Authority. Past performance is not a reliable indicator of future results; the value of investments can fall as well as rise and you may get back less than you invest. Do your own research or speak to a qualified financial adviser.