%20--%3e%3csvg%20width='63.297821mm'%20height='39.29665mm'%20viewBox='0%200%2063.297821%2039.29665'%20version='1.1'%20id='svg8765'%20inkscape:version='1.1%20(c4e8f9ed74,%202021-05-24)'%20sodipodi:docname='OBALogoSingle2.svg'%20xmlns:inkscape='http://www.inkscape.org/namespaces/inkscape'%20xmlns:sodipodi='http://sodipodi.sourceforge.net/DTD/sodipodi-0.dtd'%20xmlns='http://www.w3.org/2000/svg'%20xmlns:svg='http://www.w3.org/2000/svg'%3e%3csodipodi:namedview%20id='namedview8767'%20pagecolor='%23ffffff'%20bordercolor='%23666666'%20borderopacity='1.0'%20inkscape:pageshadow='2'%20inkscape:pageopacity='0.0'%20inkscape:pagecheckerboard='0'%20inkscape:document-units='mm'%20showgrid='false'%20fit-margin-top='0'%20fit-margin-left='0'%20fit-margin-right='0'%20fit-margin-bottom='0'%20inkscape:zoom='1.1759259'%20inkscape:cx='179.85827'%20inkscape:cy='102.04724'%20inkscape:window-width='1920'%20inkscape:window-height='972'%20inkscape:window-x='0'%20inkscape:window-y='27'%20inkscape:window-maximized='1'%20inkscape:current-layer='layer1'%20/%3e%3cdefs%20id='defs8762'%20/%3e%3cg%20inkscape:label='Layer%201'%20inkscape:groupmode='layer'%20id='layer1'%20transform='translate(-31.351095,-50.101677)'%3e%3cpath%20style='fill:none;stroke:%233584e4;stroke-width:3.965;stroke-linecap:square;stroke-linejoin:round;stroke-miterlimit:4;stroke-dasharray:none;stroke-opacity:1'%20d='m%2077.07508,77.78787%2014.84134,8.87817%20V%2052.83397%20L%2034.08359,86.5521%20V%2053.69366%20l%2015.27351,9.31107'%20id='path8388'%20sodipodi:nodetypes='cccccc'%20/%3e%3c/g%3e%3c/svg%3e)
What Is Investment Analytics? A Beginner's Guide
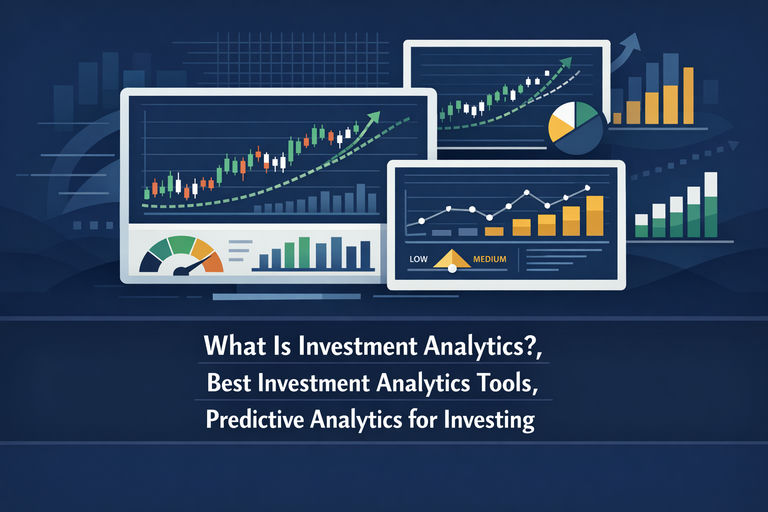
Investment analytics transforms raw financial data into actionable insight using quantitative models, risk tools, and predictive analytics. This guide covers what investment analytics means, the key categories of investment analytics tools, and how predictive analytics is reshaping modern investing.
On this page (11)
Data has always been at the heart of smart investing — but the sheer volume of financial information available today has made raw data alone nearly impossible to act on. That's where investment analytics comes in. Investment analytics is the discipline of transforming financial data into structured, actionable insight — using quantitative methods, statistical models, and increasingly, artificial intelligence to help investors understand what the numbers actually mean. Whether you're evaluating a company's earnings trajectory, measuring portfolio risk, or trying to anticipate how a sector might respond to macroeconomic shifts, investment analytics tools are what bridge the gap between information and informed decision-making. This post explores what investment analytics really encompasses, which categories of tools matter most, and how predictive analytics is reshaping the way investors approach the market.
What Is Investment Analytics?
At its core, investment analytics refers to the systematic use of data analysis techniques to evaluate securities, assess risk, and support investment decisions. It goes beyond simply reading a balance sheet or glancing at a price chart — it involves applying structured frameworks to large datasets in order to surface patterns, relationships, and probabilities that aren't immediately visible to the naked eye.
Investment analytics typically spans several disciplines:
- Quantitative analysis: Using mathematical models to evaluate financial metrics such as earnings growth, return on equity, debt ratios, and valuation multiples.
- Technical analysis: Studying historical price and volume data to identify trends, momentum signals, and potential reversal points.
- Risk analytics: Measuring portfolio volatility, correlation between assets, drawdown risk, and exposure to specific market factors.
- Sentiment analysis: Gauging market mood through news flow, social media signals, and options market positioning.
- Predictive modeling: Using statistical and machine learning techniques to forecast future price movements, earnings outcomes, or macroeconomic conditions.
What distinguishes investment analytics from general stock research is its emphasis on data-driven rigor. Rather than relying on intuition or narrative, analytics-driven investors build repeatable, testable processes — and use tools designed specifically to support that kind of systematic thinking.
Why Investment Analytics Tools Matter More Than Ever
The investment landscape has changed dramatically over the past decade. Institutional investors now deploy sophisticated algorithms and machine learning models that can process millions of data points in milliseconds. Retail investors who rely solely on headlines and gut instinct are increasingly at a disadvantage — not because they lack intelligence, but because they lack the right infrastructure.
This is precisely why investment analytics tools have become essential, not just for professionals, but for any serious investor. Modern platforms democratize access to the kind of data processing and analytical capability that was once reserved for hedge funds and investment banks. They allow individual investors to:
- Screen thousands of stocks against precise financial criteria in seconds.
- Model different valuation scenarios using real-time financial data.
- Track portfolio risk and factor exposure without a quantitative finance degree.
- Monitor earnings revisions, insider activity, and institutional ownership changes.
- Apply backtested strategies to historical data before committing capital.
The result is a more level playing field — one where disciplined, data-literate investors can compete more effectively regardless of the size of their portfolio.
Key Categories of Investment Analytical Tools
Not all investment analytical tools serve the same purpose. Understanding the different categories helps investors build a toolkit that matches their strategy and goals.
Fundamental Data Platforms
These tools provide deep financial statement data — income statements, balance sheets, cash flow statements — along with derived metrics like price-to-earnings ratios, free cash flow yield, and return on invested capital. Platforms like Morningstar and GuruFocus are widely used by value-oriented investors who want to assess a company's intrinsic worth. For example, a long-term investor analyzing Microsoft (MSFT) or Alphabet (GOOGL) would use these tools to track earnings consistency, margin trends, and capital allocation over time.
Technical Analysis and Charting Tools
Technical analysis platforms focus on price and volume data, offering chart patterns, moving averages, relative strength indicators, and momentum oscillators. StockCharts is a well-known example in this category. These tools are particularly useful for timing entries and exits, identifying trend reversals, and managing trade risk through visual pattern recognition.
Portfolio Analytics and Risk Management Tools
These platforms help investors understand how their holdings interact with one another — measuring correlation, sector concentration, beta exposure, and overall portfolio volatility. Risk analytics tools are critical for ensuring that a portfolio isn't inadvertently over-concentrated in a single factor, sector, or macroeconomic theme. Investors holding a mix of technology names like Apple (AAPL), NVIDIA (NVDA), and Meta (META), for instance, may find their portfolio is far more correlated than it appears on the surface.
Stock Screeners and Quantitative Filters
Stock screeners are among the most widely used stock market analytics tools. They allow investors to filter the entire investable universe based on specific financial, technical, or fundamental criteria — narrowing thousands of candidates down to a manageable shortlist. Finviz is a popular free option; more advanced platforms offer custom formula-based screening with real-time data.
Earnings and Estimate Tracking Tools
Earnings revisions are one of the most reliable leading indicators in equity markets. Tools that track analyst estimate changes, earnings surprise history, and guidance trends give investors an edge in anticipating how the market might reprice a stock ahead of or following a quarterly report.
Try it free
Investment analytics you can inspect
Openbook turns 16 financial metrics per company into four factor scores and two ratings out of 100 — and shows you which metrics are moving each score, rather than handing down a verdict.
Predictive Analytics for Investing: How It Works
Predictive analytics tools for the stock market represent the frontier of investment analytics — and arguably the most misunderstood category. Predictive analytics uses historical data, statistical algorithms, and machine learning models to generate probabilistic forecasts about future outcomes. It does not predict the future with certainty; rather, it assigns likelihoods to different scenarios based on patterns in the data.
In an investment context, predictive analytics can be applied in several ways:
- Earnings forecasting: Machine learning models trained on historical financials, management guidance, and macro variables can generate earnings estimates that sometimes outperform consensus analyst forecasts.
- Price momentum modeling: Algorithms that identify stocks exhibiting statistically significant momentum signals — based on relative strength, volume patterns, and factor exposure — can be used to build systematic long/short strategies.
- Sentiment and NLP analysis: Natural language processing (NLP) models scan earnings call transcripts, SEC filings, and news articles to detect shifts in tone, language, and sentiment that may precede price movements.
- Macro regime detection: Some platforms use predictive models to classify the current macroeconomic environment — growth vs. contraction, risk-on vs. risk-off — and adjust asset allocation recommendations accordingly.
- Anomaly detection: AI-driven tools can flag unusual trading patterns, abnormal options activity, or sudden changes in short interest that may signal upcoming volatility in individual stocks.
It's worth noting that predictive analytics in investing is probabilistic, not deterministic. Even the most sophisticated models carry significant uncertainty, and no tool — however advanced — can reliably predict short-term market movements with consistent accuracy. The value of predictive analytics lies in improving the quality of the decision-making process, not in eliminating risk.
What to Look for in Investment Analytics Tools
With hundreds of platforms competing for investors' attention, it can be difficult to know which investment analytics tools are genuinely worth using. Here are the key criteria to evaluate:
- Data quality and coverage: The accuracy and breadth of the underlying data is the foundation of any analytics platform. Look for tools that source data directly from regulatory filings and reputable financial data providers.
- Transparency of methodology: For any scoring system, ranking model, or predictive output, the platform should clearly explain how the metric is calculated. Black-box outputs with no explanation are difficult to trust or act on responsibly.
- Customizability: The best tools allow investors to define their own criteria rather than forcing them into pre-built templates. Custom screening formulas, adjustable valuation inputs, and flexible dashboards are signs of a mature platform.
- Historical data depth: Backtesting a strategy requires years — ideally decades — of historical data. Platforms with shallow data histories limit an investor's ability to stress-test ideas across different market cycles.
- Ease of use: Analytical power is only valuable if it's accessible. The best platforms balance sophistication with usability, presenting complex data in ways that are intuitive without being oversimplified.
- Integration capabilities: For more advanced users, the ability to export data, connect via API, or integrate with portfolio management software significantly extends the utility of any analytics platform.
No card required
Start the analytics habit for nothing
Screening, portfolio factor exposure and score history are all on the free plan. No trial clock, no card.
Conclusion: Building an Analytics-Driven Investment Process
Investment analytics is not a silver bullet — no tool or model can guarantee returns or eliminate the inherent uncertainty of financial markets. But for investors who are serious about making better decisions, building a structured, data-driven process is one of the most durable edges available. The right combination of investment analytics tools — covering fundamental data, technical signals, risk measurement, and predictive modeling — gives investors a framework for thinking more clearly, acting more consistently, and avoiding the emotional pitfalls that derail so many portfolios.
As the technology continues to evolve, the gap between investors who embrace analytics and those who don't is likely to widen. The good news is that access to powerful stock market analytics tools has never been more democratized. The question isn't whether to use them — it's which ones to use, and how to integrate them into a coherent investment process that reflects your own goals, time horizon, and risk tolerance.
Worth reading
What sits behind the numbers
Analytics you cannot interrogate are just opinions with decimal places. The published methodology sets out every input and weighting.
You can Compare MSFT, GOOGL, AAPL, NVDA, META side by side on Openbook, or find stocks with the screener.
Related analysis

Co-founder of Openbook Analytics. Andrew studied Finance and Economics at the University of Strathclyde and writes on UK & US equities, stock valuation models, and portfolio strategy.
This article is for information and education only. It is not investment advice and not a recommendation to buy, sell or hold any investment. Openbook Analytics Ltd is not authorised or regulated by the Financial Conduct Authority. Past performance is not a reliable indicator of future results; the value of investments can fall as well as rise and you may get back less than you invest. Do your own research or speak to a qualified financial adviser.