%20--%3e%3csvg%20width='63.297821mm'%20height='39.29665mm'%20viewBox='0%200%2063.297821%2039.29665'%20version='1.1'%20id='svg8765'%20inkscape:version='1.1%20(c4e8f9ed74,%202021-05-24)'%20sodipodi:docname='OBALogoSingle2.svg'%20xmlns:inkscape='http://www.inkscape.org/namespaces/inkscape'%20xmlns:sodipodi='http://sodipodi.sourceforge.net/DTD/sodipodi-0.dtd'%20xmlns='http://www.w3.org/2000/svg'%20xmlns:svg='http://www.w3.org/2000/svg'%3e%3csodipodi:namedview%20id='namedview8767'%20pagecolor='%23ffffff'%20bordercolor='%23666666'%20borderopacity='1.0'%20inkscape:pageshadow='2'%20inkscape:pageopacity='0.0'%20inkscape:pagecheckerboard='0'%20inkscape:document-units='mm'%20showgrid='false'%20fit-margin-top='0'%20fit-margin-left='0'%20fit-margin-right='0'%20fit-margin-bottom='0'%20inkscape:zoom='1.1759259'%20inkscape:cx='179.85827'%20inkscape:cy='102.04724'%20inkscape:window-width='1920'%20inkscape:window-height='972'%20inkscape:window-x='0'%20inkscape:window-y='27'%20inkscape:window-maximized='1'%20inkscape:current-layer='layer1'%20/%3e%3cdefs%20id='defs8762'%20/%3e%3cg%20inkscape:label='Layer%201'%20inkscape:groupmode='layer'%20id='layer1'%20transform='translate(-31.351095,-50.101677)'%3e%3cpath%20style='fill:none;stroke:%233584e4;stroke-width:3.965;stroke-linecap:square;stroke-linejoin:round;stroke-miterlimit:4;stroke-dasharray:none;stroke-opacity:1'%20d='m%2077.07508,77.78787%2014.84134,8.87817%20V%2052.83397%20L%2034.08359,86.5521%20V%2053.69366%20l%2015.27351,9.31107'%20id='path8388'%20sodipodi:nodetypes='cccccc'%20/%3e%3c/g%3e%3c/svg%3e)
Why it matters
Crude, product, dry-bulk and gas carriers. These themes often connect to policy, commodity cycles, infrastructure spending and long investment lead times.
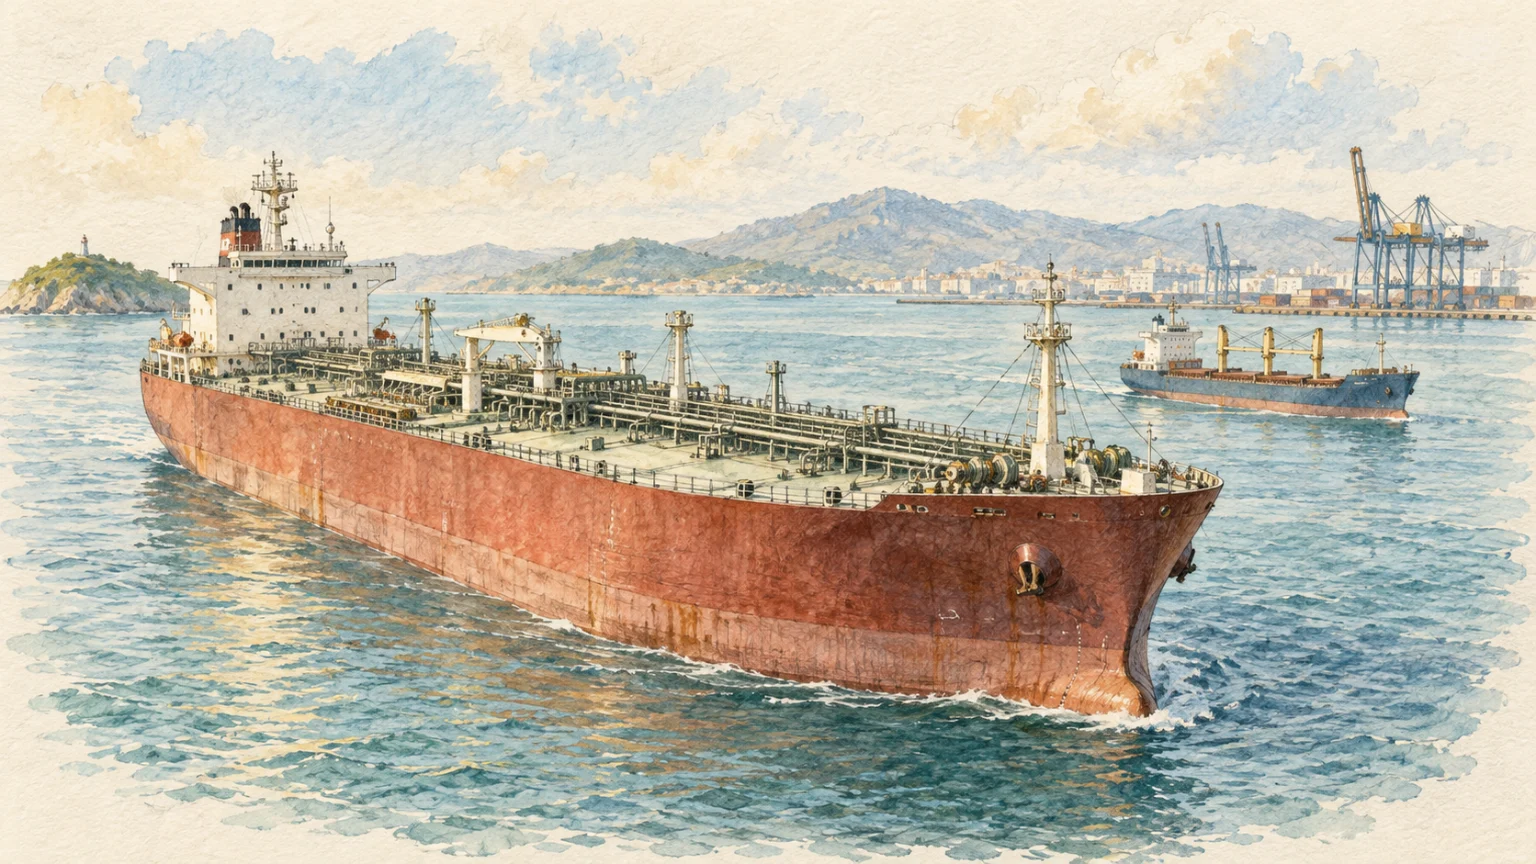
Crude, product, dry-bulk and gas carriers.
Shipping is the most cyclical corner of the market: day rates can multiply in a year when tonne-miles stretch and vessel supply cannot answer. This collection spans crude and product tankers, dry bulk, container owners and gas carriers across both markets. A freight-rate trade — read the Risk rating before the yield.
Crude, product, dry-bulk and gas carriers. These themes often connect to policy, commodity cycles, infrastructure spending and long investment lead times.
Check backlog quality, project execution, input costs, balance-sheet resilience and sensitivity to commodity prices or government budgets.
Cyclical demand, cost overruns, regulation and commodity volatility can overwhelm even a strong long-term infrastructure or energy story.
| Company | Market | Market Cap | Reward | Risk | Yield | |
|---|---|---|---|---|---|---|
| Frontline LtdFRO | $11.7B | 10.4% | ||||
| Kirby CorporationKEX | $7.3B | — | ||||
| Matson IncMATX | $6.9B | 0.6% | ||||
| CMB.TECH NVCMBT | $5.8B | 4.0% | ||||
| International Seaways IncINSW | $5.7B | 0.4% | ||||
| Hafnia LimitedHAFN | $5.5B | 11.0% | ||||
| Golar LNG LimitedGLNG | $5.0B | 2.1% | ||||
| Scorpio Tankers IncSTNG | $4.3B | 2.0% | ||||
| Torm PLC Class ATRMD | $4.1B | 11.1% | ||||
| DHT Holdings IncDHT | $3.8B | 20.7% | ||||
| Teekay Tankers LtdTNK | $3.6B | 1.0% | ||||
| ZIM Integrated Shipping Services LtdZIM | $3.6B | 4.0% | ||||
| Star Bulk Carriers CorpSBLK | $3.6B | 6.2% | ||||
| Okeanis Eco Tankers Corp.ECO | $3.4B | 11.1% | ||||
| Danaos CorporationDAC | $3.0B | 2.2% | ||||
| Navios Maritime Partners LP UnitNMM | $2.7B | 0.3% | ||||
| Dorian LPG LtdLPG | $2.4B | 5.9% | ||||
| ClarksonCKN | £1.5B | 2.3% | ||||
| Costamare IncCMRE | $1.9B | 3.1% | ||||
| SFL Corporation LtdSFL | $1.9B | 6.5% | ||||
| Nordic American Tankers LimitedNAT | $1.8B | 12.8% | ||||
| FLEX LNG LtdFLNG | $1.7B | 9.6% | ||||
| Global Ship Lease IncGSL | $1.7B | 5.5% | ||||
| Irish Continental Group plcICGC | £979.9M | 1.6% | ||||
| Capital Clean Energy Carriers Corp.CCEC | $1.3B | 2.8% | ||||
| Genco Shipping & Trading LtdGNK | $1.2B | 6.6% | ||||
| Safe Bulkers IncSB | $1.0B | 1.1% | ||||
| Himalaya Shipping Ltd.HSHP | $857.1M | 0.0% | ||||
| Ardmore ShpngASC | $788.4M | 7.1% |
Crude, product, dry-bulk and gas carriers. It currently holds 29 stocks, each rated by Openbook's Reward and Risk scores. Shipping is the most cyclical corner of the market: day rates can multiply in a year when tonne-miles stretch and vessel supply cannot answer.
Shipping & Tankers is a curated basket of companies with direct exposure to this theme, screened against live market data and ranked by market capitalisation.
Prices, ratings and rankings rebuild from live market data every time the page loads. The membership of the basket itself is reviewed and revised by hand on a regular cadence, so newly-listed or no-longer-relevant companies are added and removed as the theme moves.
Openbook's Reward rating combines a stock's growth, momentum, profitability and valuation into a single 0–100 score, and the Risk rating scores financial strength, volatility and size. Use them to compare names within this theme — broadly, a higher Reward alongside a lower Risk is more attractive. They are quantitative research signals, not investment advice.
Openbook Reward and Risk ratings and factor scores are quantitative signals for research, not investment advice. Data may be delayed. Some US-listed names carry partial factor coverage.


