%20--%3e%3csvg%20width='63.297821mm'%20height='39.29665mm'%20viewBox='0%200%2063.297821%2039.29665'%20version='1.1'%20id='svg8765'%20inkscape:version='1.1%20(c4e8f9ed74,%202021-05-24)'%20sodipodi:docname='OBALogoSingle2.svg'%20xmlns:inkscape='http://www.inkscape.org/namespaces/inkscape'%20xmlns:sodipodi='http://sodipodi.sourceforge.net/DTD/sodipodi-0.dtd'%20xmlns='http://www.w3.org/2000/svg'%20xmlns:svg='http://www.w3.org/2000/svg'%3e%3csodipodi:namedview%20id='namedview8767'%20pagecolor='%23ffffff'%20bordercolor='%23666666'%20borderopacity='1.0'%20inkscape:pageshadow='2'%20inkscape:pageopacity='0.0'%20inkscape:pagecheckerboard='0'%20inkscape:document-units='mm'%20showgrid='false'%20fit-margin-top='0'%20fit-margin-left='0'%20fit-margin-right='0'%20fit-margin-bottom='0'%20inkscape:zoom='1.1759259'%20inkscape:cx='179.85827'%20inkscape:cy='102.04724'%20inkscape:window-width='1920'%20inkscape:window-height='972'%20inkscape:window-x='0'%20inkscape:window-y='27'%20inkscape:window-maximized='1'%20inkscape:current-layer='layer1'%20/%3e%3cdefs%20id='defs8762'%20/%3e%3cg%20inkscape:label='Layer%201'%20inkscape:groupmode='layer'%20id='layer1'%20transform='translate(-31.351095,-50.101677)'%3e%3cpath%20style='fill:none;stroke:%233584e4;stroke-width:3.965;stroke-linecap:square;stroke-linejoin:round;stroke-miterlimit:4;stroke-dasharray:none;stroke-opacity:1'%20d='m%2077.07508,77.78787%2014.84134,8.87817%20V%2052.83397%20L%2034.08359,86.5521%20V%2053.69366%20l%2015.27351,9.31107'%20id='path8388'%20sodipodi:nodetypes='cccccc'%20/%3e%3c/g%3e%3c/svg%3e)
Best Investment Analytics Tools for 2026
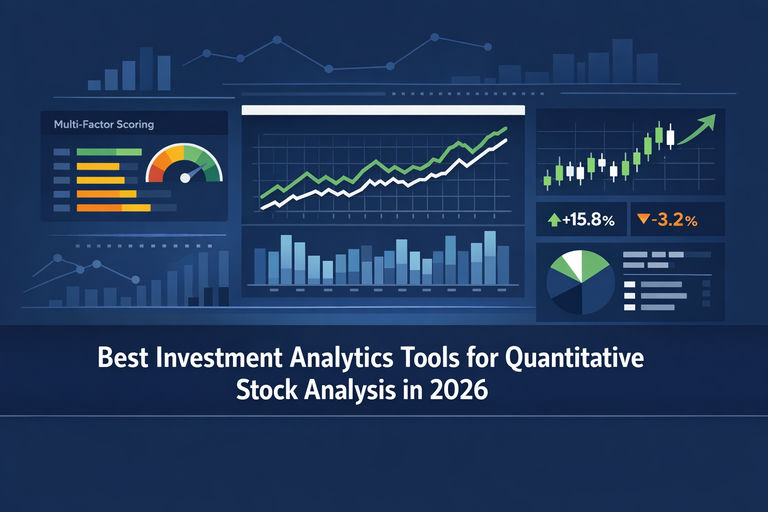
Explore the best investment analytics tools for quantitative stock analysis in 2026, from multi-factor rating systems to AI-augmented screeners and backtesting platforms. Learn which tools suit your investor profile and how to build a rigorous, data-driven workflow.
On this page (8)
The landscape of investment analytics tools has changed dramatically over the past few years. What was once the exclusive domain of hedge funds and institutional quant desks — multi-factor scoring models, backtesting engines, AI-driven pattern recognition — is now accessible to any serious individual investor with a laptop and a subscription. But accessibility has created its own problem: there are now dozens of platforms claiming to offer quantitative stock analysis, and choosing the wrong one for your workflow can mean paying for features you never use while missing the ones you actually need. This guide cuts through the noise by examining what the best investment analytics tools for quantitative stock analysis actually do in 2026, what separates them from one another, and how to match the right tool to your specific approach.
What Makes a Tool Genuinely Quantitative?
Not every platform that displays a chart or a P/E ratio qualifies as a quantitative analysis tool. True quantitative stock analysis involves applying mathematical models, statistical methods, and systematic rules to evaluate securities — removing as much subjective judgment as possible from the process. When assessing any platform, look for these core capabilities:
- Multi-factor scoring: The ability to evaluate stocks across several measurable dimensions simultaneously — valuation, momentum, earnings quality, financial health, and growth — rather than relying on a single metric.
- Backtesting: The ability to test a strategy or set of rules against historical price and fundamental data to assess how it would have performed over time.
- Systematic screening: Filtering a universe of stocks using quantitative criteria, not just qualitative descriptions or analyst opinions.
- Data depth and freshness: Quantitative models are only as good as the data feeding them. Look for platforms that offer at least five to ten years of historical financials and update their data frequently.
- Transparency of methodology: The best stock market analytics tools explain how their scores and signals are constructed, so you can evaluate whether the underlying logic makes sense for your strategy.
With those criteria in mind, here is how the leading platforms stack up in 2026.
Multi-Factor Rating Systems: Quantitative Analysis Made Accessible
For investors who want the output of a quantitative model without building one from scratch, multi-factor rating systems are the most practical entry point into quantitative analysis stocks. These platforms do the heavy lifting — aggregating dozens or hundreds of data points into a single composite score — and present the results in a format that is easy to act on.
Seeking Alpha Premium is one of the most widely used examples. Its Quant Ratings system evaluates stocks across five factor categories — Value, Growth, Profitability, Momentum, and EPS Revisions — and assigns letter grades (A+ through F) to each. The composite rating is sector-relative, meaning a stock is scored against its peers rather than the entire market, which reduces the distortion that comes from comparing a utility company to a technology firm. The platform also provides ten years of downloadable financial data, making it useful for investors who want to build their own models on top of the provided scores.
Platforms like OpenBook Analytics take a similar philosophy — making rigorous, data-driven analysis available to investors who want institutional-quality insights without needing a programming background. The key differentiator to look for in any multi-factor tool is whether the factor weights are static or dynamic, and whether the methodology has been validated against real market outcomes rather than just back-fitted to historical data.
Backtesting and Strategy Validation Platforms
If multi-factor ratings represent the "what" of quantitative stock analysis — identifying which stocks score well — backtesting platforms address the "how" — validating whether a particular set of rules would have generated consistent results over time. This is where stock market quantitative analysis becomes genuinely rigorous.
TrendSpider is one of the most capable platforms in this category for individual investors. It offers a visual strategy backtesting engine that allows users to build and test rules-based trading strategies against decades of historical price data without writing code. Its automated technical analysis features — including algorithm-driven trendline detection and pattern recognition — bring a level of systematic discipline to chart-based analysis that manual review simply cannot match. For investors who trade on shorter timeframes or want to validate momentum-based rules, TrendSpider's combination of backtesting depth and charting sophistication is difficult to beat.
Finviz Elite also offers a backtesting module alongside its renowned screening engine, covering up to 24 years of historical data. While less sophisticated than TrendSpider's environment, it is a practical option for investors who primarily use Finviz for screening and want to add basic strategy validation without switching platforms.
When evaluating any backtesting tool, watch for overfitting — the risk that a strategy looks exceptional in historical tests because it was tuned to past data rather than reflecting a genuine, repeatable edge. The best platforms include out-of-sample testing features or at least provide enough historical depth to allow you to hold back a validation period.
AI-Augmented Quantitative Tools: The 2026 Differentiator
The most significant development in investment analytical tools over the past two years has been the integration of machine learning and artificial intelligence into quantitative workflows. This is no longer a novelty feature — in 2026, AI augmentation is a genuine differentiator between platforms that surface actionable signals and those that simply display data.
The most meaningful AI applications in predictive analytics tools for stock market use fall into three categories:
- Pattern recognition at scale: Neural network models trained on decades of price and fundamental data can identify subtle, non-linear relationships between variables that traditional factor models miss. Platforms like WallStreetZen's Zen Ratings incorporate a neural network component as one of seven factor grades, providing a forward-looking signal that complements traditional valuation and momentum metrics.
- Natural language processing for earnings and filings: Several institutional-grade platforms now use NLP to parse earnings call transcripts, SEC filings, and news sentiment at scale — feeding that qualitative signal into a quantitative score. AlphaSense is a leading example at the professional end of the market.
- Adaptive screening: Some newer platforms adjust their screening criteria dynamically based on current market regime — tightening valuation filters in high-multiple environments and relaxing them during broad market corrections. This regime-awareness is a meaningful improvement over static factor models.
The caveat with AI-driven tools is the same as with any quantitative model: the quality of the output depends entirely on the quality of the training data and the soundness of the underlying methodology. Always look for platforms that disclose how their models are trained and validated.
Screening as the Foundation of Quantitative Workflow
Even the most sophisticated multi-factor model or backtesting engine needs a starting universe of stocks to work with. That is why a powerful, flexible screener remains the foundation of any serious stocks quantitative analysis workflow, regardless of what other tools you layer on top.
Finviz remains the benchmark for free quantitative screening in 2026. Its screener supports simultaneous filtering across dozens of fundamental, technical, and descriptive criteria — P/E ratios, EPS growth rates, debt-to-equity, relative strength, short float, and more. The free version uses delayed data, but for long-term fundamental screening, that limitation rarely matters. Finviz Elite adds real-time data, intraday charting, and the backtesting module mentioned above.
For investors focused on factor-based strategies, Koyfin offers a more analytically oriented screening environment with stronger data visualization and the ability to build custom financial models directly within the platform. It sits between a traditional screener and a full financial data terminal, making it well-suited to investors who want to go deeper on individual names after an initial quantitative filter.
The practical workflow for most quantitative investors combines a broad screener (to narrow a universe of thousands of stocks to a manageable shortlist) with a multi-factor rating tool (to rank that shortlist by composite quality) and a backtesting environment (to validate the rules driving the initial screen). No single platform does all three equally well, which is why most serious practitioners use two or three tools in combination.
Quantitative, and free
Rank the universe before you filter it
Openbook scores every company on Growth, Momentum, Profitability and Value, then rolls those into Reward and Risk ratings out of 100 — so screening starts from a ranking rather than a stack of arbitrary thresholds.
Matching Tools to Investor Profile
The right combination of investment analytics tools depends heavily on your investment style, time horizon, and technical comfort level. Here is a practical framework:
- Long-term fundamental investors who want quantitative validation of their thesis will get the most value from multi-factor rating platforms like Seeking Alpha Premium or OpenBook Analytics, combined with a screener like Finviz to generate initial ideas. Backtesting is less critical for this group, though access to long-run financial data is essential.
- Systematic or rules-based investors who want to build and test specific strategies need a dedicated backtesting environment. TrendSpider is the strongest option for technically oriented strategies; Finviz Elite covers basic needs at lower cost.
- Swing and momentum traders benefit most from platforms that combine real-time quantitative signals with alert functionality. Services like Stock Market Guides, which deliver alerts derived from statistically backtested setups, are designed specifically for this use case.
- Investors new to quantitative methods should start with a platform that translates complex multi-factor analysis into clear, actionable output — letter grades, composite scores, or ranked lists — before attempting to build custom models. Accessibility matters as much as analytical depth at this stage.
It is also worth noting that the major index constituents — companies like Microsoft (MSFT), Alphabet (GOOGL), and JPMorgan Chase (JPM) — are well-covered by virtually every platform on this list. Where tools diverge most meaningfully is in their coverage of mid- and small-cap stocks, where data quality varies and quantitative signals tend to be more differentiated.
Transparency test
Check the maths before you trust the model
Any quantitative tool is only as good as its published method. Openbook sets out all 16 inputs, the four factor scores and the weighting behind every rating.
What to Look for When Evaluating Any Platform
Before committing to any stock market analytics tool, apply the same analytical discipline you would to a stock. Ask these questions:
- How is the methodology documented? Reputable platforms explain their factor definitions, data sources, and model construction. Opacity is a red flag.
- What is the data update frequency? For momentum and technical factors, daily updates are the minimum. For fundamental factors, quarterly updates aligned with earnings cycles are acceptable.
- How far back does the historical data go? A minimum of ten years — covering at least one full market cycle — is necessary for meaningful backtesting. Twenty years is better.
- Is there a free trial or limited free tier? Most serious platforms offer at least a trial period. Use it to test the specific features you plan to rely on, not just the interface.
- Does the platform integrate with your existing workflow? Data export capabilities, API access, and compatibility with spreadsheet tools matter if you plan to build custom models on top of the platform's data.
Conclusion: Building a Quantitative Toolkit That Works for You
The best investment analytics tools for quantitative stock analysis in 2026 are not necessarily the most expensive or the most feature-rich — they are the ones that match your investment process and that you will actually use consistently. A multi-factor rating system you trust and apply systematically will outperform a sophisticated backtesting engine you use once and abandon. Start with the layer of quantitative analysis that addresses your biggest current gap — whether that is idea generation, stock ranking, or strategy validation — and build from there. The goal is not to replicate a quant hedge fund's infrastructure, but to bring more discipline, consistency, and data-driven rigor to the decisions you are already making.
No card required
Build the quantitative workflow free
Factor-based screening, portfolio factor exposure and score history are all on the free plan, with no trial clock to race.
You can Compare MSFT, GOOGL, JPM side by side on Openbook, or find stocks with the screener.
Related analysis

Co-founder of Openbook Analytics. Andrew studied Finance and Economics at the University of Strathclyde and writes on UK & US equities, stock valuation models, and portfolio strategy.
This article is for information and education only. It is not investment advice and not a recommendation to buy, sell or hold any investment. Openbook Analytics Ltd is not authorised or regulated by the Financial Conduct Authority. Past performance is not a reliable indicator of future results; the value of investments can fall as well as rise and you may get back less than you invest. Do your own research or speak to a qualified financial adviser.