%20--%3e%3csvg%20width='63.297821mm'%20height='39.29665mm'%20viewBox='0%200%2063.297821%2039.29665'%20version='1.1'%20id='svg8765'%20inkscape:version='1.1%20(c4e8f9ed74,%202021-05-24)'%20sodipodi:docname='OBALogoSingle2.svg'%20xmlns:inkscape='http://www.inkscape.org/namespaces/inkscape'%20xmlns:sodipodi='http://sodipodi.sourceforge.net/DTD/sodipodi-0.dtd'%20xmlns='http://www.w3.org/2000/svg'%20xmlns:svg='http://www.w3.org/2000/svg'%3e%3csodipodi:namedview%20id='namedview8767'%20pagecolor='%23ffffff'%20bordercolor='%23666666'%20borderopacity='1.0'%20inkscape:pageshadow='2'%20inkscape:pageopacity='0.0'%20inkscape:pagecheckerboard='0'%20inkscape:document-units='mm'%20showgrid='false'%20fit-margin-top='0'%20fit-margin-left='0'%20fit-margin-right='0'%20fit-margin-bottom='0'%20inkscape:zoom='1.1759259'%20inkscape:cx='179.85827'%20inkscape:cy='102.04724'%20inkscape:window-width='1920'%20inkscape:window-height='972'%20inkscape:window-x='0'%20inkscape:window-y='27'%20inkscape:window-maximized='1'%20inkscape:current-layer='layer1'%20/%3e%3cdefs%20id='defs8762'%20/%3e%3cg%20inkscape:label='Layer%201'%20inkscape:groupmode='layer'%20id='layer1'%20transform='translate(-31.351095,-50.101677)'%3e%3cpath%20style='fill:none;stroke:%233584e4;stroke-width:3.965;stroke-linecap:square;stroke-linejoin:round;stroke-miterlimit:4;stroke-dasharray:none;stroke-opacity:1'%20d='m%2077.07508,77.78787%2014.84134,8.87817%20V%2052.83397%20L%2034.08359,86.5521%20V%2053.69366%20l%2015.27351,9.31107'%20id='path8388'%20sodipodi:nodetypes='cccccc'%20/%3e%3c/g%3e%3c/svg%3e)
Why it matters
Integrated majors, producers, refiners and pipelines. These themes often connect to policy, commodity cycles, infrastructure spending and long investment lead times.
Integrated majors, producers, refiners and pipelines.
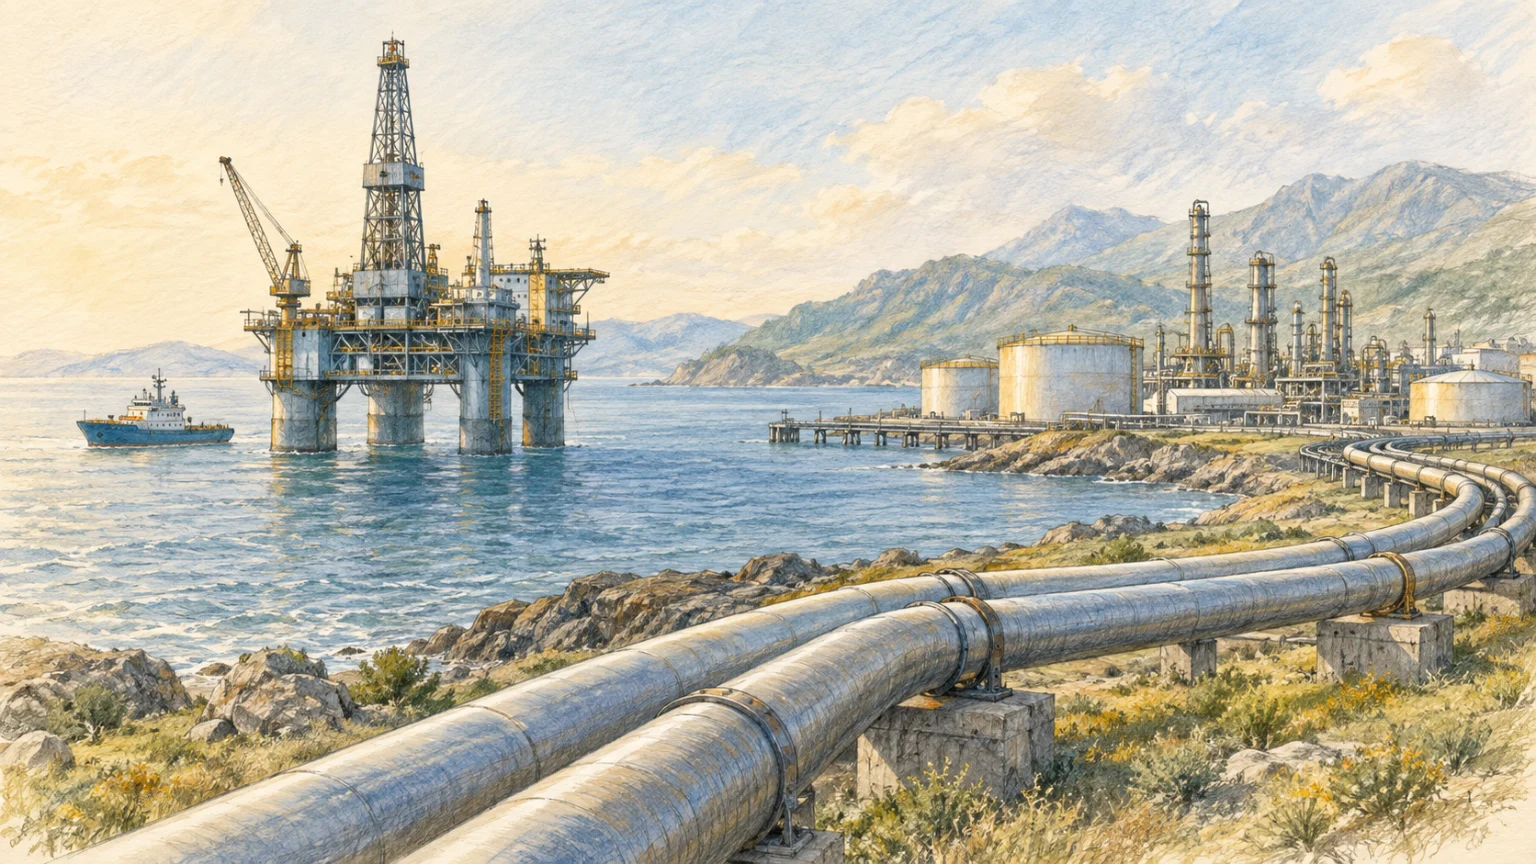
Oil and gas still funds a large share of the world’s dividends and moves with every geopolitical shock. This collection spans the integrated majors, exploration and production, refining, midstream pipelines and the services firms that drill the wells — ranked by market cap. Tankers are excluded; they have their own collection.
Integrated majors, producers, refiners and pipelines. These themes often connect to policy, commodity cycles, infrastructure spending and long investment lead times.
Check backlog quality, project execution, input costs, balance-sheet resilience and sensitivity to commodity prices or government budgets.
Cyclical demand, cost overruns, regulation and commodity volatility can overwhelm even a strong long-term infrastructure or energy story.
Showing the 40 largest of 249 — sort or filter to explore the rest.
Integrated majors, producers, refiners and pipelines. It currently holds 249 stocks, each rated by Openbook's Reward and Risk scores. Oil and gas still funds a large share of the world’s dividends and moves with every geopolitical shock.
Constituents are chosen by a rules-based screen over the full UK and US common-stock universe, then ranked by market capitalisation.
It is rebuilt from live market data, so the constituents and their rankings update as prices and company fundamentals change — there is no fixed, hand-edited list.
Openbook's Reward rating combines a stock's growth, momentum, profitability and valuation into a single 0–100 score, and the Risk rating scores financial strength, volatility and size. Use them to compare names within this theme — broadly, a higher Reward alongside a lower Risk is more attractive. They are quantitative research signals, not investment advice.
Openbook Reward and Risk ratings and factor scores are quantitative signals for research, not investment advice. Data may be delayed. Some US-listed names carry partial factor coverage.


