%20--%3e%3csvg%20width='63.297821mm'%20height='39.29665mm'%20viewBox='0%200%2063.297821%2039.29665'%20version='1.1'%20id='svg8765'%20inkscape:version='1.1%20(c4e8f9ed74,%202021-05-24)'%20sodipodi:docname='OBALogoSingle2.svg'%20xmlns:inkscape='http://www.inkscape.org/namespaces/inkscape'%20xmlns:sodipodi='http://sodipodi.sourceforge.net/DTD/sodipodi-0.dtd'%20xmlns='http://www.w3.org/2000/svg'%20xmlns:svg='http://www.w3.org/2000/svg'%3e%3csodipodi:namedview%20id='namedview8767'%20pagecolor='%23ffffff'%20bordercolor='%23666666'%20borderopacity='1.0'%20inkscape:pageshadow='2'%20inkscape:pageopacity='0.0'%20inkscape:pagecheckerboard='0'%20inkscape:document-units='mm'%20showgrid='false'%20fit-margin-top='0'%20fit-margin-left='0'%20fit-margin-right='0'%20fit-margin-bottom='0'%20inkscape:zoom='1.1759259'%20inkscape:cx='179.85827'%20inkscape:cy='102.04724'%20inkscape:window-width='1920'%20inkscape:window-height='972'%20inkscape:window-x='0'%20inkscape:window-y='27'%20inkscape:window-maximized='1'%20inkscape:current-layer='layer1'%20/%3e%3cdefs%20id='defs8762'%20/%3e%3cg%20inkscape:label='Layer%201'%20inkscape:groupmode='layer'%20id='layer1'%20transform='translate(-31.351095,-50.101677)'%3e%3cpath%20style='fill:none;stroke:%233584e4;stroke-width:3.965;stroke-linecap:square;stroke-linejoin:round;stroke-miterlimit:4;stroke-dasharray:none;stroke-opacity:1'%20d='m%2077.07508,77.78787%2014.84134,8.87817%20V%2052.83397%20L%2034.08359,86.5521%20V%2053.69366%20l%2015.27351,9.31107'%20id='path8388'%20sodipodi:nodetypes='cccccc'%20/%3e%3c/g%3e%3c/svg%3e)
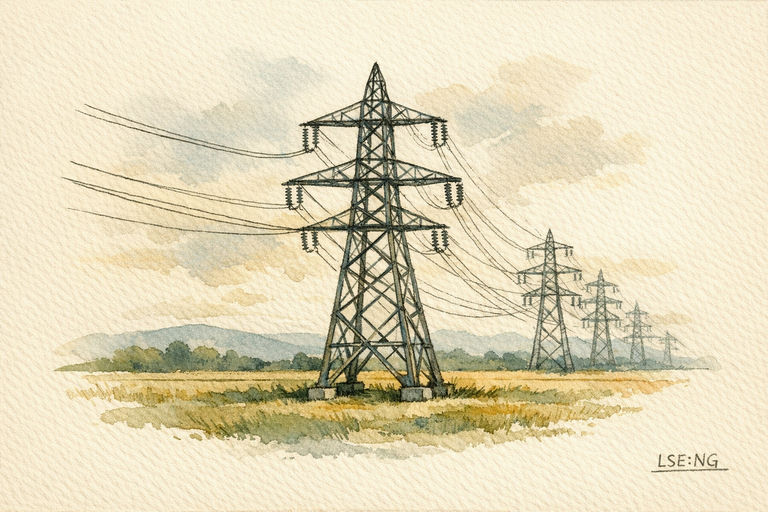
National Grid plc (NG) occupies an unusual corner of the FTSE 100. Most large listed companies live or die on whether customers choose them. National Grid mostly owns the wires and pipes that customers have no practical alternative to using, and charges regulated prices for the privilege. That makes any serious National Grid share price analysis less a question of market share or brand strength and more a question of regulation, capital deployment and financing cost. The group runs the high-voltage electricity transmission network in England and Wales, one of Britain's largest electricity distribution businesses, and regulated electricity and gas utilities in New York and New England. In the year to 31 March 2026 it invested a record amount of capital, and the shape of the following five years is now largely set by regulators on both sides of the Atlantic.
What National Grid Actually Owns
The organisation is best understood as a portfolio of regulated network businesses rather than an energy company in the conventional sense. It does not produce oil or gas, and since a deliberate reshaping of the portfolio it no longer runs a meaningful generation or renewables development arm either.
In the United Kingdom, the UK Electricity Transmission segment owns and operates the high-voltage backbone across England and Wales. UK Electricity Distribution comprises the former Western Power Distribution networks in the East Midlands, West Midlands, South West England and South Wales, acquired from PPL Corporation in 2021 at an equity value of £7.8 billion. At the time of the deal, WPD served roughly eight million customers across some 55,500 square kilometres of network.
In the United States, the New York and New England segments own electricity distribution, high-voltage transmission and gas distribution networks. These are rate-regulated utilities, and their economics are set through periodic rate cases rather than through market pricing.
Alongside the reshaping has come simplification. National Grid sold its remaining minority stake in National Gas Transmission in September 2024, and in the 2025/26 financial year completed the disposals of Grain LNG and National Grid Renewables, generating £2.8 billion of net cash proceeds. The stated direction of travel is a pureplay networks group.
The FY2026 Numbers in Detail
National Grid reports on a financial year ending 31 March and publishes full-year and half-year figures rather than quarterly results. The FY2026 results, covering the year ended 31 March 2026, were reported on 14 May 2026.
Statutory revenue fell 4% to £17.6 billion, a decline that reflects the disposals described above rather than a shrinking core. Below that line the picture was one of growth:
- Underlying operating profit rose £459 million at constant currency to £5,680 million, up 9%.
- Underlying earnings per share reached 78.0p, up 8% at constant currency.
- Statutory earnings per share came in at 65.5p, up 9%.
- Capital investment hit a record £11,576 million, 21% higher at constant currency.
- Asset growth was 10.9%, with regulated asset growth of 11.7%.
The segment detail is worth reading, because the divisions moved in different directions. UK Electricity Transmission delivered underlying operating profit of around £1.7 billion, £254 million higher than the prior year, driven by higher allowed revenues and inflation indexation while controllable costs were held flat. UK Electricity Distribution added £35 million, a 3% increase. New York was up 6% on updated rates and the recovery of costs unremunerated in earlier periods. New England produced underlying operating profit of £866 million and was broadly flat: updated Massachusetts electric rates through the capital tracker mechanism were offset by customer refunds following a Federal Energy Regulatory Commission order on transmission owner returns on equity across New England, much of it relating to historical years. National Grid Ventures was lower, principally because of the two business disposals.
One number that rarely makes headlines but matters to cash flow is timing. Under-recoveries in 2025/26 were £537 million, mainly linked to revenue decoupling in the downstate New York gas businesses and the levelisation of new rate increases at Niagara Mohawk, together with lower auction prices on transmission wheeling. Timing differences of this kind are generally recovered in later periods, but they move reported cash in the year they occur.
Regulation Is the Business Model
For a regulated network, the allowed return set by the regulator is closer to a revenue line than to a background condition. Two regulatory tracks dominate.
In Britain, Ofgem published its RIIO-3 Final Determinations on 4 December 2025, covering the price control period from 1 April 2026 to 31 March 2031. For National Grid Electricity Transmission, the determination set a real allowed cost of equity of 6.12% at 60% notional gearing. Across the electricity transmission, gas distribution and gas transmission sectors together, Ofgem approved £28.1 billion of upfront investment, sitting within a wider potential pipeline of around £90 billion over the RIIO-3 period. Because the current financial year is the first year of RIIO-T3, FY2027 is the first full period in which those parameters apply.
In the United States, returns are negotiated utility by utility. National Grid agreed a new Niagara Mohawk electric and gas rate case with an allowed return on equity of 9.5%, supporting rate base growth of 10% to $25.4 billion — a figure reported in US dollars, as the American businesses are. The company has also signalled a rate filing for its downstate New York gas distribution businesses, KEDNY and KEDLI. The FERC ruling on New England transmission owner returns is a reminder that US regulatory outcomes can run the other way, producing refunds for historical periods.
Funding a £70 Billion Investment Programme
Alongside the FY2026 results, National Grid extended and upgraded its five-year financial framework to 2030/31. The headline commitments are at least £70 billion of capital investment over the period, asset growth of around 10% a year, and underlying earnings per share growth of 8% to 10%.
Investment of that scale has to be funded, and the balance sheet shows the strain and the offsets. Net debt stood at £44.2 billion at 31 March 2026, £2.8 billion higher than a year earlier, with the increase from record capital spending partly offset by the £2.8 billion of net proceeds from the Grain LNG and National Grid Renewables disposals. Regulatory gearing was 61% in 2025/26, and the company has indicated it expects that measure to trend back towards the high 60s by 2030/31.
Shareholders have direct experience of what a funding gap can mean. In May 2024 National Grid launched a 7-for-24 rights issue raising approximately £7 billion at 645p per new share, the largest UK rights issue since 2010, explicitly to fund a higher-growth investment phase. That episode is part of the durable context for any National Grid share price analysis: the group's growth is capital-hungry, and the mix of debt, disposals, retained earnings and equity used to fund it is a live variable rather than a settled one.
On distributions, the board recommended a final dividend of 32.14p per share, taking the full-year dividend to 48.49p, an increase of 3.8%. The stated policy is to grow the annual dividend per share in line with UK CPIH inflation, which aims to hold the payout flat in real terms rather than to track earnings growth.
What a National Grid Share Price Analysis Has to Measure
National Grid's ordinary shares are quoted in London in pence. The shares stood at 1,190.00p — that is £11.90, not £1,190 — at 31 July 2026, within a 52-week range of 1,000.50p to 1,428.50p, giving a market capitalisation in the region of £59 billion. The distinction between pence and pounds matters: it is the single easiest way to be wrong about a London-listed price by a factor of one hundred.
On those figures, the shares changed hands at roughly 15 times FY2026 underlying earnings of 78.0p and around 18 times statutory earnings of 65.5p. The gap between the two multiples is itself informative: it reflects items the company strips out of its underlying measure, including disposal effects and certain remeasurements, and a reader comparing National Grid with peers should be clear which basis is being used. The trailing dividend yield on 48.49p at 1,190p is approximately 4.1%.
A price-to-earnings multiple measures what the market is paying today for a year of reported profit; it says nothing on its own about whether that profit is durable. For a regulated network, analysts more often anchor on the multiple of regulated asset value, because allowed revenues are calculated from the asset base and because asset growth of the kind National Grid is targeting mechanically drags earnings with it over time. Peers such as SSE plc (SSE) in electricity networks and generation, and water utilities including Severn Trent (SVT), are assessed on similar regulated-asset logic, though their regulators, price control cycles and risk profiles differ.
Risks and Sensitivities
The risks in a business like this are not usually about demand. They cluster elsewhere.
- Financing cost. With £44.2 billion of net debt and gearing expected to rise, the cost at which debt is refinanced feeds directly into earnings. Allowed returns are set in real terms, so the relationship between market interest rates and regulated returns is not instantaneous.
- Regulatory outcomes. RIIO-T3 parameters are now fixed for five years, but incentive performance within them is not. In the US, each rate case is a separate negotiation, and the New England FERC order shows that adverse rulings can reach back into historical years.
- Delivery. Spending at least £70 billion over five years assumes supply chains, consents and skilled labour are available at assumed costs. Underspend delays asset growth; overspend that regulators disallow is not recovered.
- Currency. A substantial share of operating profit is earned in US dollars and translated into sterling, which is why the company reports growth at constant currency.
- Funding mix. The 2024 rights issue demonstrated that equity is part of the toolkit when the investment plan expands.
What to Watch From Here
The next scheduled checkpoints are straightforward. National Grid publishes half-year results in November, which will be the first substantial read on FY2027 and on the opening year of the RIIO-T3 price control. The downstate New York gas rate filing for KEDNY and KEDLI is the most significant near-term US regulatory item. Beyond that, the metrics that would most change the picture are capital investment actually delivered against the £11.6 billion FY2026 run rate, the trajectory of regulatory gearing towards the high-60s range the company has flagged, and whether underlying earnings per share growth tracks inside the 8% to 10% framework.
None of this resolves into a simple verdict, and it is not meant to. A National Grid share price analysis is largely an exercise in judging how reliably a regulated asset base converts into allowed revenue, how that revenue is funded, and how much of it reaches shareholders after financing costs. The FY2026 figures give a clear reading on all three at a single point in time; the regulatory and funding decisions of the next five years will determine whether that reading holds.
Discussion
Log in to join the discussion