
AstraZeneca (AZN) Stock Analysis
Stock of the Month | February 2026
8 min
Executive Summary
- The Story: AstraZeneca's oncology-led pipeline has delivered exceptional 3-year growth: 13.1% revenue CAGR and 251.6% net income CAGR, with a deep late-stage pipeline across oncology, rare disease, and immunology.
- Valuation: P/E of 29.3x looks demanding, but a PEG of 0.96 suggests the stock is fairly priced relative to its growth rate.
- Catalysts: Multiple Phase III readouts in 2026; continued oncology franchise expansion; potential new blockbusters from ADC platform.
- Key Risk: Patent cliffs on key drugs, China regulatory risk following recent probes, and 28.5% annualized volatility.
Openbook Risk/Reward Matrix
5-Year Share Price History
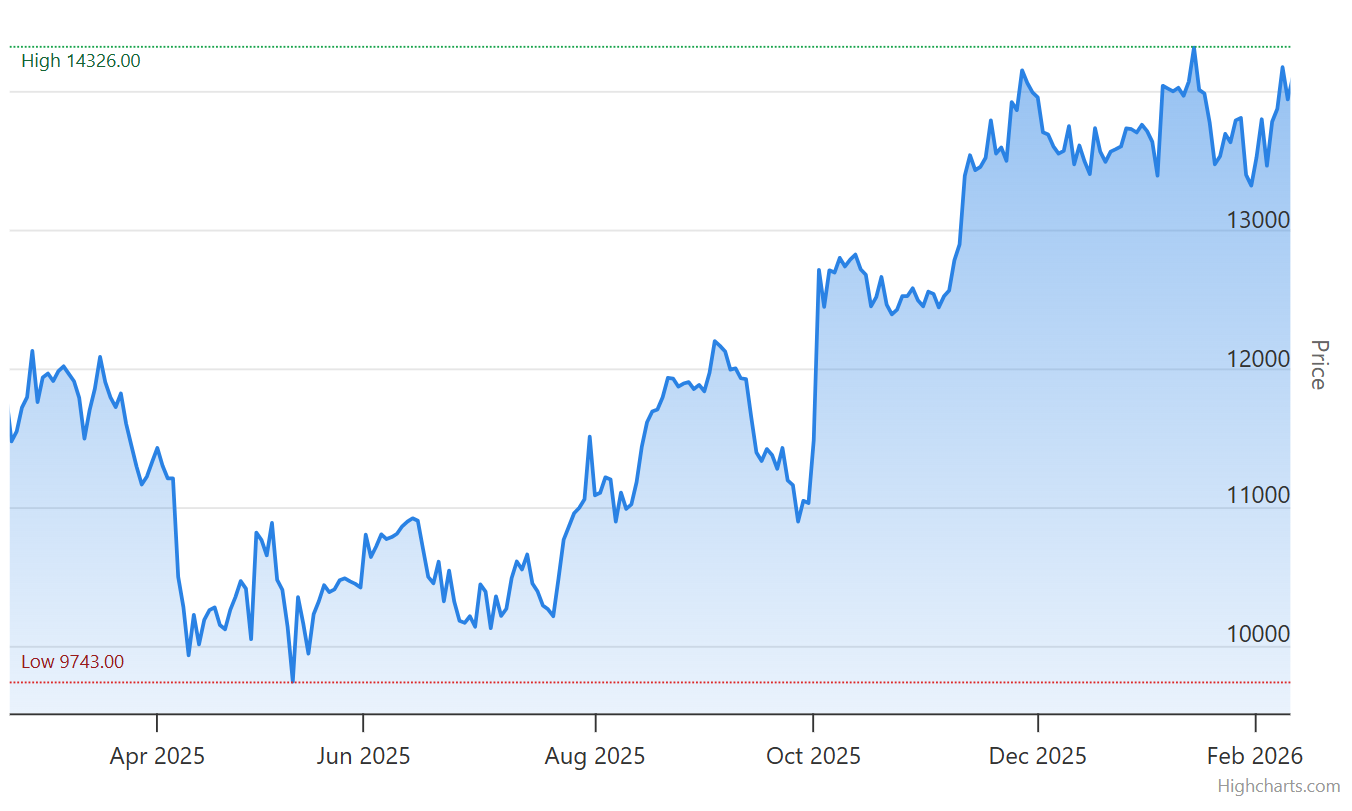
From around £80 in 2021 to £130+ today. Steady upward trajectory driven by oncology pipeline success.
Reward Analysis
Our reward score analyses AZN's potential upside using 5 weighted factors.
What's driving this: Key drivers include (1) Tagrisso, Imfinzi, and Enhertu delivering double-digit revenue growth; (2) Rare disease franchise (Alexion acquisition) fully integrated and contributing; (3) FCF growing at 24.6% CAGR over 3 years.
The net income CAGR is inflated by a low 2021–22 base when AZN was investing heavily in R&D and integrating Alexion. Growth is now normalising but remains strong.
Strong momentum. The +19.8% 12-month return coincides with positive oncology pipeline developments. 6-month return of 24.7% shows recent acceleration.
3m return (+4.1%) is modest. Watch for continued acceleration or mean reversion.
Valuation appears reasonable relative to growth. P/E of 29.3x is demanding in isolation, but PEG of 0.96 suggests GARP credentials.
P/E: 29.3x · EV/EBITDA: 10.8x · PEG: 0.96
Excellent. Net margin of 13.0% with EBIT growth of 15.5%. ROE of 19.8% and ROA of 8.2% demonstrate strong capital efficiency. Quality compounder profile.
Large Cap (£166.9B). Typically more stable and liquid with historically lower volatility than smaller peers. FTSE 100 constituent.
Risk Analysis
Our risk score assesses AZN's downside potential using 5 weighted factors.
What this means practically: At 28.5% annualised volatility, short-term price swings can be material. The -19.7% max drawdown is within range of what large-cap growth stocks have historically experienced.
Context: Lower volatility than most growth stocks. AZN's large-cap status and defensive pharma characteristics help dampen price swings.
Low leverage risk. Net Debt/Equity of 0.60x is manageable. Interest coverage of 6.2x provides flexibility. Net debt of £24.6B is covered by strong cash generation.
Very robust. FCF margin of 13.5%, Cash ROA of 11.4%. Net margin of 13.0% with margin stability at 6.1%. Consistent cash generation buffers against downturns.
Large-cap (£166.9B) provides stability. Diversified across oncology, rare disease, respiratory, and cardiovascular segments.
AZN vs Pharma Peers
How AstraZeneca stacks up against Novo Nordisk & Roche
Scenario Analysis
What could AZN be worth in 3 years? Based on current price of ~£130.
Pipeline delivers 3+ blockbusters from ADC platform. Revenue hits $80B target by 2030. P/E holds at 28x.
£185 (+42%)Steady 10–12% revenue growth, patent cliffs managed through pipeline. P/E compresses to 24x.
£155 (+19%)Key trial failures, China probe escalates, patent cliffs hit harder than expected. P/E contracts to 18x.
£90 (-31%)These are illustrative scenarios, not forecasts. Actual outcomes depend on clinical trial results, regulatory decisions, and competitive dynamics.
What Would Change Our View
- Net margin falls below 10% for 2 consecutive quarters
- Key Phase III trial failures in the oncology pipeline
- China regulatory risk escalates materially (revenue exposure ~13%)
- Patent cliff on Tagrisso without adequate pipeline replacement
What the Bears Say
Contrarian views and analyst concerns worth considering.
Berenberg · October 2025
"AZN's P/E of 29x is demanding for a pharma company. While pipeline is strong, valuations already price in significant success from late-stage assets."
Patent Cliff Analysis · January 2026
"Tagrisso faces generic competition from 2028. At $5B+ in annual sales, this patent cliff requires multiple pipeline wins to offset. History shows pharma companies often stumble here."
China Risk · December 2025
"The Chinese regulatory investigation into AZN's operations adds uncertainty. China represents ~13% of revenue, and any disruption could materially impact growth forecasts."
Margin Concerns · February 2026
"Net margins at 13% are below pharma peers like Novo Nordisk (34.8%). AZN's heavy R&D spend is a double-edged sword — necessary for pipeline but compresses current profitability."
Our Take on the Bear Case
The valuation concerns are legitimate — at 30x earnings, AZN needs to keep executing. However, guidance has continued to beat expectations. The bears are right that easy gains may be behind; the question is whether operational momentum can sustain the multiple. Investors should consider their own risk tolerance and position sizing accordingly.
The Investment Case
A balanced view of the bullish and bearish factors.
Bull Case
- Pipeline depth: 190+ projects across oncology, rare disease, and immunology with multiple late-stage readouts due in 2026
- Growth trajectory: 13.1% revenue CAGR with $80B revenue target by 2030 is ambitious but supported by existing franchise growth
- GARP credentials: PEG of 0.96 indicates growth at a reasonable price — relatively uncommon in large-cap pharma
- Defensive quality: Healthcare spending has historically been more recession-resistant; AZN may offer growth with some defensive characteristics
Bear Case
- Patent cliff risk: Tagrisso ($5B+ revenue) faces generic competition from 2028. Pipeline must deliver to offset losses
- China exposure: ~13% of revenue from China with ongoing regulatory probe adding uncertainty
- Margin gap: Net margin of 13% trails Novo Nordisk's 34.8%, reflecting higher R&D intensity and integration costs
The Bottom Line
AZN exhibits characteristics of a quality compounder with genuine pipeline depth, rather than a speculative pharma play. The 86/100 reward score and 33/100 risk score place it in the "Sweet Spot" quadrant of our matrix — relatively high upside potential with contained downside risk for a £167B FTSE 100 constituent.
Our observation: At a PEG of 0.96, AZN's valuation appears reasonable relative to its growth rate. The key risks remain the Tagrisso patent cliff and China exposure, though the pipeline depth may provide a buffer. At 28.5% annualised volatility, AZN sits below many growth stocks on this measure. This is not a recommendation to buy or sell.
Key catalysts to watch: Phase III readouts (H1 2026), Tagrisso replacement data, China regulatory resolution, and progress toward $80B 2030 revenue target.
Access deeper data, live scores, and portfolio tools