|
|
|
APPLE INC
Innovation and Excellence
|
|
Stock Of The Month
NOV 2025 - ISSUE #002
|
|
|
Executive Summary:
- Q4 Performance: $102.5B revenue (+8% YoY); Services hit record $108.6B annually (26% of revenue, ~50% of profits)
- Cash Generation: $98.8B free cash flow with $110B+ returned annually via dividends and buybacks (40% share count reduction)
- Valuation: Trading at 30x P/E; DCF models suggest 15-27% premium to intrinsic value
- Catalysts: Apple Intelligence rollout, iPhone 17 upgrade cycle, holiday sales momentum
- Risks: Regulatory pressure (EU/UK), tariff costs ($800M-$1.1B quarterly), competitive AI positioning
|
What Apple Does
Apple designs and manufactures consumer electronics (iPhone, iPad, Mac, wearables) plus a growing services business (App Store, iCloud, Apple Pay, AppleCare). The ecosystem creates powerful lock-in effects.
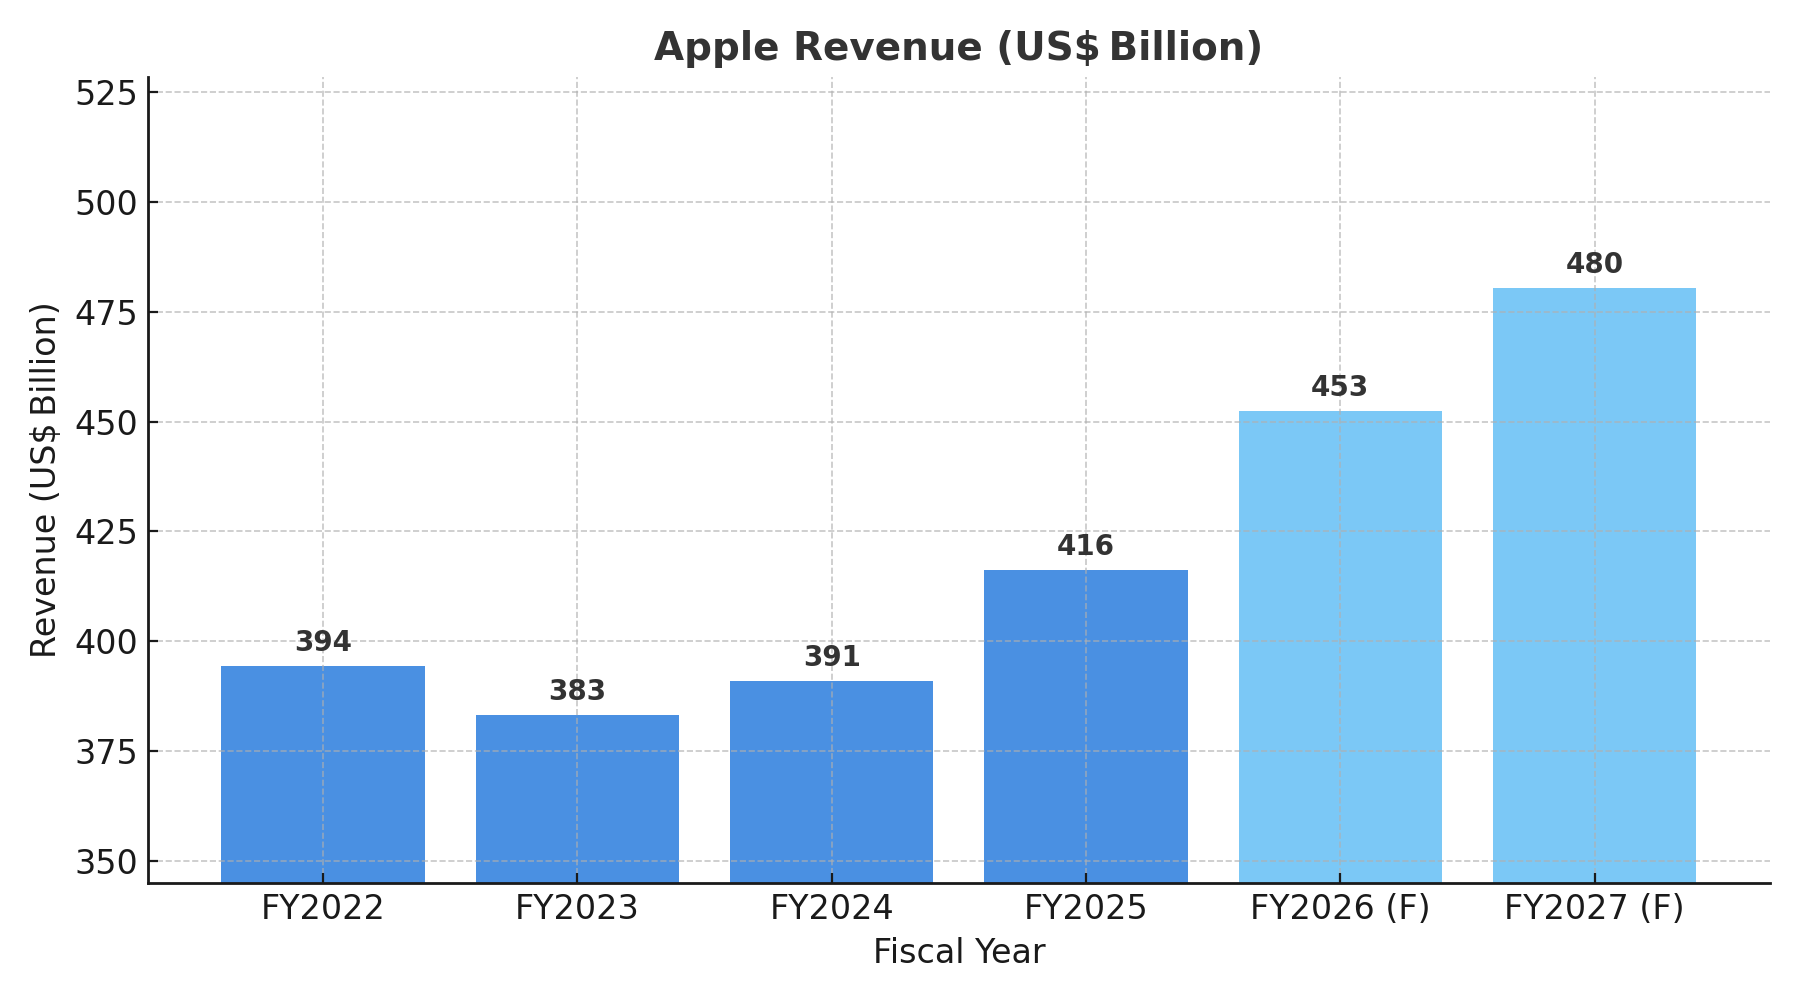
FY2025: $416B revenue • Q4: $102.5B (+8% YoY) • Services: $108.6B (record high)
|
Share Price
$273.00
Market Cap
$4.13T
P/E Ratio
30.3x
|
|
5-Year Share Price Performance
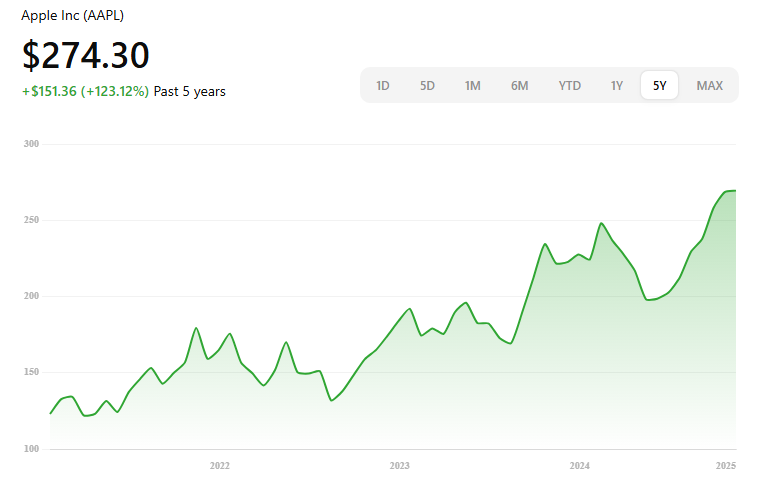
Strong Long-Term Performance: Apple's stock has more than doubled over the past 5 years, delivering a +107% total return from $132 in late 2020 to $273 today. Despite a 2022 bear market pullback (down to $129), the stock recovered strongly through 2023-2025 driven by iPhone upgrade cycles, services expansion, and aggressive share buybacks. The steady upward trajectory reflects Apple's brand resilience, ecosystem strength, and consistent capital returns to shareholders.
|
💰 Apple's Revenue Breakdown
|
Product Category
|
Revenue
|
% of Total
|
|
iPhone
Flagship product line
|
$208B
|
50%
|
|
Services 🔥
App Store, iCloud, Apple Pay, etc.
|
$108.6B
|
26%
|
|
Mac
MacBook, iMac, Mac Studio
|
$37.4B
|
9%
|
|
iPad
iPad Pro, iPad Air, iPad Mini
|
$33.3B
|
8%
|
|
Wearables & Accessories
AirPods, Apple Watch, HomePod
|
$28.7B
|
7%
|
|
Free Cash Flow Projection & Valuation
Apple's cash generation machine continues its strong trajectory, with Free Cash Flow (FCF) expected to grow significantly through 2028 as services scale and operational efficiency improves.
|
Fiscal Year
|
Free Cash Flow
|
YoY Growth
|
|
FY2022
|
$111.4B
|
—
|
|
FY2023
|
$99.6B
|
-10.6%
|
|
FY2024
|
$108.8B
|
+9.2%
|
|
FY2025
|
$98.8B
|
-9.2%
|
|
FY2026E
|
$127.6B
|
+29.2%
|
|
FY2027E
|
$138.0B
|
+8.2%
|
|
FY2028E
|
$154.7B
|
+12.1%
|
🔍 Discounted Cash Flow (DCF) Analysis
Multiple DCF models from reputable sources suggest Apple's current share price of $275.41 trades 15–27% above calculated intrinsic value, depending on growth and discount rate assumptions. This reflects investor optimism about AI monetization and services expansion but signals limited margin of safety at current levels.
|
Scenario
|
Fair Value
|
vs. Current
|
|
Bear Case
|
$196.54
|
-27%
|
|
Base Case
|
$220.39
|
-20%
|
|
Bull Case
|
$263.30
|
-4%
|
Standard DCF Assumptions (10-Year Model)
|
• Starting FCF: $97–110B
|
• WACC: 9–10%
|
|
• FCF Growth: 4–6% annually
|
• Terminal Growth: 2.5–3%
|
⚠️ Valuation Risk: Most DCF models indicate Apple trades at a premium to intrinsic value (15–27% overvalued). The bullish case ($263) requires optimistic AI revenue growth and sustained services margin expansion. Current valuation leaves limited margin of safety for long-term value investors, though quality and brand strength support premium multiples.
|
The Investment Case
Apple's investment thesis balances significant growth opportunities against notable headwinds. While the company's ecosystem strength and innovation pipeline provide resilience, investors must weigh regulatory challenges and valuation premiums.
🚀 Growth Tailwinds
- AI Integration: Apple Intelligence features drive iPhone upgrades and create new revenue streams
- Services Growth: High-margin recurring revenue (App Store, iCloud, subscriptions) now 26% of total sales
- Ecosystem Lock-In: 2B+ active devices create powerful customer retention and cross-selling opportunities
- Capital Returns: $110B+ annually via buybacks and dividends reduces shares outstanding, boosting per-share earnings
|
⚠️ Key Risks
- Regulatory & Tariff Headwinds: Facing antitrust investigations in Europe over App Store practices, while new trade tariffs add $800M-$1.1B in quarterly costs
- AI Competition: Apple entered the AI race later than competitors like Google and Microsoft, potentially limiting market share in emerging AI applications
- Premium Valuation: At 30x earnings, the stock price already reflects high expectations—leaving little room for error if growth disappoints
|
|
The Bottom Line
Strong Q4 performance driven by services (now 25% of revenue, ~50% of profits). Apple returns $110B+ annually to shareholders through dividends and aggressive buybacks, reducing share count 40% over the past decade.
Key catalysts: holiday sales, Apple Intelligence adoption, services momentum. Main risks: regulatory pressure, tariff costs ($800M-$1.1B quarterly), and competitive AI positioning.
|
|
Coming Next Month
December 2025 Stock of the Month
|
Stay tuned...
|
|
|