%20--%3e%3csvg%20width='63.297821mm'%20height='39.29665mm'%20viewBox='0%200%2063.297821%2039.29665'%20version='1.1'%20id='svg8765'%20inkscape:version='1.1%20(c4e8f9ed74,%202021-05-24)'%20sodipodi:docname='OBALogoSingle2.svg'%20xmlns:inkscape='http://www.inkscape.org/namespaces/inkscape'%20xmlns:sodipodi='http://sodipodi.sourceforge.net/DTD/sodipodi-0.dtd'%20xmlns='http://www.w3.org/2000/svg'%20xmlns:svg='http://www.w3.org/2000/svg'%3e%3csodipodi:namedview%20id='namedview8767'%20pagecolor='%23ffffff'%20bordercolor='%23666666'%20borderopacity='1.0'%20inkscape:pageshadow='2'%20inkscape:pageopacity='0.0'%20inkscape:pagecheckerboard='0'%20inkscape:document-units='mm'%20showgrid='false'%20fit-margin-top='0'%20fit-margin-left='0'%20fit-margin-right='0'%20fit-margin-bottom='0'%20inkscape:zoom='1.1759259'%20inkscape:cx='179.85827'%20inkscape:cy='102.04724'%20inkscape:window-width='1920'%20inkscape:window-height='972'%20inkscape:window-x='0'%20inkscape:window-y='27'%20inkscape:window-maximized='1'%20inkscape:current-layer='layer1'%20/%3e%3cdefs%20id='defs8762'%20/%3e%3cg%20inkscape:label='Layer%201'%20inkscape:groupmode='layer'%20id='layer1'%20transform='translate(-31.351095,-50.101677)'%3e%3cpath%20style='fill:none;stroke:%233584e4;stroke-width:3.965;stroke-linecap:square;stroke-linejoin:round;stroke-miterlimit:4;stroke-dasharray:none;stroke-opacity:1'%20d='m%2077.07508,77.78787%2014.84134,8.87817%20V%2052.83397%20L%2034.08359,86.5521%20V%2053.69366%20l%2015.27351,9.31107'%20id='path8388'%20sodipodi:nodetypes='cccccc'%20/%3e%3c/g%3e%3c/svg%3e)
Portfolio Tracker for UK Investors
A portfolio tracker for UK investors is a tool that shows all your shares and funds in one place, so you can understand how your portfolio is actually behaving over time.
Rather than checking prices one by one or relying on broker statements, a tracker pulls everything together: performance, allocation, income, and risk. It's most useful for long-term investors who want clarity and structure, not constant monitoring.
What a tracker does well is give you structure. Instead of checking prices one by one across different broker apps, you see the whole picture: performance, allocation, income, and concentration — in one view.
What a portfolio tracker does (in practice)
At its core, a portfolio tracker answers a few basic questions:
- How is my portfolio performing overall?
- What do I actually own, and in what proportions?
- Where are my gains, losses, and income coming from?
- How concentrated is my portfolio?
In practice, many investors underestimate how fragmented their view is. Shares might be held across multiple brokers, ISAs, or accounts. A tracker acts as a single reference point.
→ Try openbook's portfolio tracker
Why UK investors benefit from a dedicated tracker
UK investors face some specific challenges that generic tools don't always handle well:
- Multiple wrappers – ISAs, SIPPs, and taxable accounts each have different tax treatment. See HMRC's guidance on ISAs for current allowances.
- LSE-listed shares and UK funds – Many global tools prioritise US markets. Companies on the London Stock Exchange deserve proper support.
- Dividend-heavy portfolios – UK investors often rely on income, making dividend tracking essential.
- Home bias – Many portfolios lean heavily towards the UK market, which creates concentration risk.
A UK-focused portfolio tracker typically handles these realities more cleanly, without requiring workarounds or manual adjustments.
How to choose a portfolio tracker
When evaluating portfolio trackers for UK investing, consider these factors:
1. UK market coverage
Does it support LSE-listed shares, investment trusts, and UK funds? Many global tools focus on US markets and treat UK holdings as secondary.
2. Multi-account support
Can you add holdings from different ISAs, SIPPs, and taxable accounts? The best trackers let you view accounts together or separately.
3. Automatic data updates
Does it pull prices and dividend data automatically, or do you need to enter everything manually? Automation reduces errors over time.
4. Historical tracking
Does it store your portfolio history so you can see trends over months and years, not just today's snapshot?
5. Performance clarity
Can you easily see time-weighted returns, money-weighted returns, or both? Understanding how returns are calculated matters.
6. Simplicity vs depth
Is the interface clean enough for periodic review, or does it overwhelm with dashboards and metrics? The best tracker is one you'll actually use.
What a good portfolio tracker should show
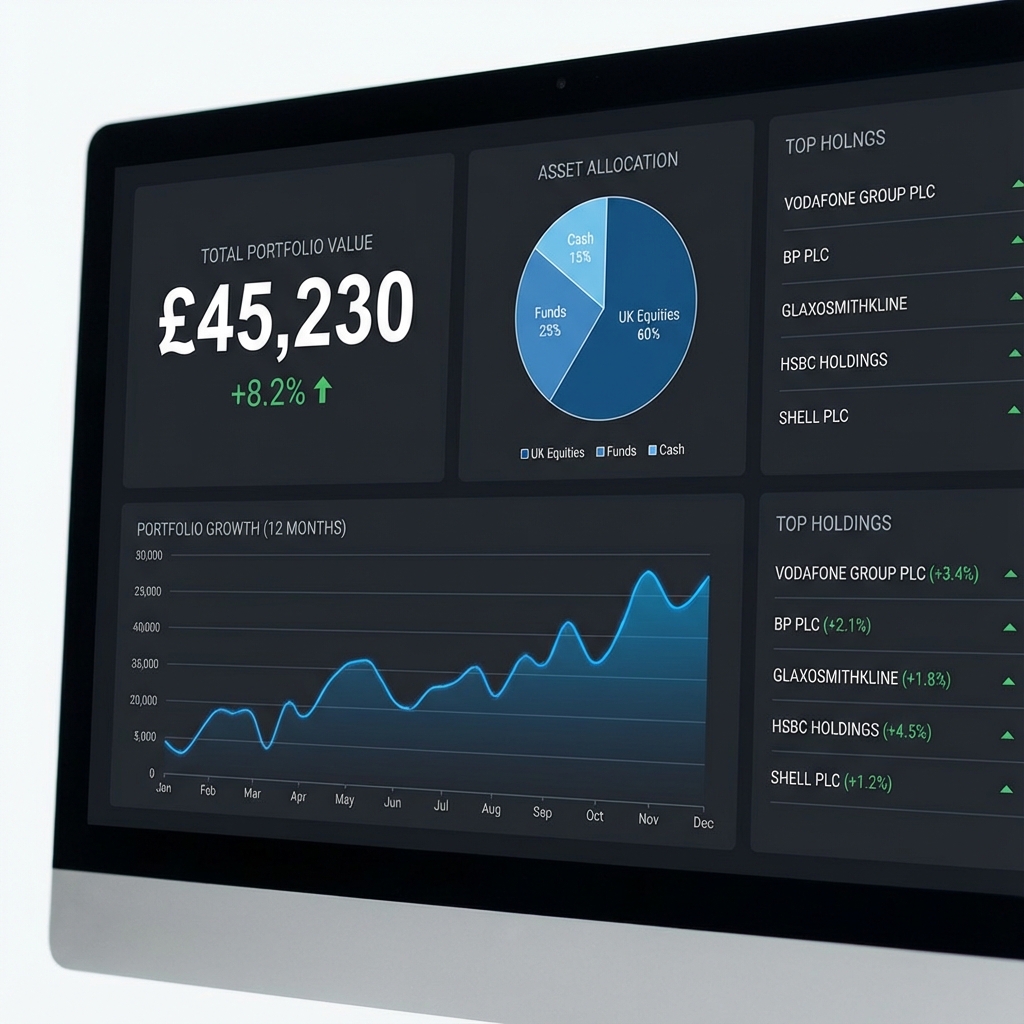
Not all trackers are equally helpful. The most useful ones focus on clarity and decision-support, rather than overwhelming detail.
Key features to look for include:
- Total portfolio value over time
- Performance (overall and by holding)
- Asset allocation (shares, funds, cash)
- Sector and geographic exposure
- Income and dividends, if relevant
- Contribution vs market movement (what you added vs what the market did)
Portfolio tracking vs checking prices
Many investors confuse tracking with price-watching.
Checking prices answers:
Portfolio tracking answers:
In practice, trackers are most valuable when used periodically — monthly or quarterly — rather than daily. Constant checking can increase noise without improving decisions.
Common metrics explained in plain English
Portfolio performance
This usually compares your current portfolio value to what you've put in. It helps separate market movement from contributions.
Allocation
Allocation shows how your money is split across holdings, sectors, or regions. It's often where unintended risks show up.
Concentration
Concentration highlights reliance on a small number of shares. Many investors are surprised by how dominant one holding becomes over time.
Income
For income-focused investors, tracking dividends alongside capital value gives a more complete picture of returns.
How portfolio trackers handle multiple accounts
A common challenge for UK investors is having:
- A stocks and shares ISA
- A workplace pension or SIPP
- A taxable account
A good portfolio tracker lets you see these together and separately. This helps you understand overall exposure without losing account-level detail.
For guidance on pension allowances, see HMRC's pension contribution rules.
Portfolio trackers vs spreadsheets
Spreadsheets are a common starting point, but they come with trade-offs.
| Feature | Spreadsheet | Dedicated Tracker |
|---|---|---|
| Cost | Free | Free or subscription |
| Customisation | Fully flexible | Limited |
| Data updates | Manual | Automatic |
| Historical accuracy | Prone to drift | Consistent |
| Multi-account view | Complex formulas | Usually built-in |
| Time investment | High (ongoing) | Low (after setup) |
When spreadsheets work well:
- You have a small, simple portfolio
- You enjoy building and maintaining formulas
- You want complete control over calculations
When a tracker makes more sense:
- Your portfolio spans multiple accounts or brokers
- You want automatic price updates
- You value long-term trend visibility without manual effort
Typically, investors move away from spreadsheets as their portfolio grows or becomes more complex.
Common mistakes when using a portfolio tracker
- Over-focusing on short-term performance – daily moves rarely matter long-term.
- Ignoring allocation drift – portfolios change shape over time as some holdings grow faster than others.
- Assuming past performance equals future results – trackers show history, not certainty.
- Using too many metrics – simplicity often leads to better understanding.
- Forgetting to review regularly – trackers work best with periodic, structured reviews.
Track Your Portfolio on Openbook
Manually monitoring your shares and funds across multiple accounts is time-consuming and error-prone — and most broker dashboards only show the accounts they hold, not your whole picture.
Openbook connects your UK holdings into one view and adds a layer that broker apps don't have: an 8-factor Reward and Risk framework where sufficient data is available. Instead of just seeing a price and a return, you can see whether Growth, Profitability, Financial Solvency, and Operational Quality have changed — which is usually the signal worth paying attention to.
Try looking up a holding you've owned for a while: Shell, Lloyds, AstraZeneca, or BP.
openbook lets you:
- See all your UK shares and funds in one dashboard, with factor scores alongside price
- Track performance over time — total return including dividends, not just price change
- Understand allocation and concentration: which holdings, sectors, and factors dominate your risk
- Monitor dividend income alongside Operational Quality and Financial Solvency risk factors to investigate sustainability
Start free with openbook (no card) →