%20--%3e%3csvg%20width='63.297821mm'%20height='39.29665mm'%20viewBox='0%200%2063.297821%2039.29665'%20version='1.1'%20id='svg8765'%20inkscape:version='1.1%20(c4e8f9ed74,%202021-05-24)'%20sodipodi:docname='OBALogoSingle2.svg'%20xmlns:inkscape='http://www.inkscape.org/namespaces/inkscape'%20xmlns:sodipodi='http://sodipodi.sourceforge.net/DTD/sodipodi-0.dtd'%20xmlns='http://www.w3.org/2000/svg'%20xmlns:svg='http://www.w3.org/2000/svg'%3e%3csodipodi:namedview%20id='namedview8767'%20pagecolor='%23ffffff'%20bordercolor='%23666666'%20borderopacity='1.0'%20inkscape:pageshadow='2'%20inkscape:pageopacity='0.0'%20inkscape:pagecheckerboard='0'%20inkscape:document-units='mm'%20showgrid='false'%20fit-margin-top='0'%20fit-margin-left='0'%20fit-margin-right='0'%20fit-margin-bottom='0'%20inkscape:zoom='1.1759259'%20inkscape:cx='179.85827'%20inkscape:cy='102.04724'%20inkscape:window-width='1920'%20inkscape:window-height='972'%20inkscape:window-x='0'%20inkscape:window-y='27'%20inkscape:window-maximized='1'%20inkscape:current-layer='layer1'%20/%3e%3cdefs%20id='defs8762'%20/%3e%3cg%20inkscape:label='Layer%201'%20inkscape:groupmode='layer'%20id='layer1'%20transform='translate(-31.351095,-50.101677)'%3e%3cpath%20style='fill:none;stroke:%233584e4;stroke-width:3.965;stroke-linecap:square;stroke-linejoin:round;stroke-miterlimit:4;stroke-dasharray:none;stroke-opacity:1'%20d='m%2077.07508,77.78787%2014.84134,8.87817%20V%2052.83397%20L%2034.08359,86.5521%20V%2053.69366%20l%2015.27351,9.31107'%20id='path8388'%20sodipodi:nodetypes='cccccc'%20/%3e%3c/g%3e%3c/svg%3e)
Fundamental Analysis for Beginners: A Practical Guide
Learn the core principles of fundamental stock analysis — from reading financial statements to applying key valuation metrics and using the right fundamental analysis tools to research companies with confidence.
On this page (18)
Most investors know they should be looking at a company's fundamentals before putting money to work — but far fewer know exactly what that means in practice. Fundamental stock analysis is the process of evaluating a company's intrinsic value by examining its financial health, business model, competitive position, and growth prospects. Unlike technical analysis, which focuses on price charts and trading patterns, fundamental analysis asks a more basic question: is this business actually worth owning? This guide walks through the core building blocks of fundamental analysis in a practical, structured way — so you can start applying it to real companies with confidence.
What Is Fundamental Analysis and Why Does It Matter?
At its core, fundamental analysis is about separating price from value. A stock's price is what the market is currently willing to pay. Its value is what the underlying business is actually worth, based on its assets, earnings power, and future prospects. The gap between those two numbers is where opportunity — or risk — lives.
This approach was popularised by Benjamin Graham and later refined by investors like Warren Buffett. The central idea is that over time, a stock's price tends to converge toward its intrinsic value. If you can identify companies trading below their intrinsic value, you may be positioned to benefit when the market eventually recognises that gap.
Fundamental analysis matters because it grounds your investment decisions in business reality rather than market sentiment. It won't tell you what a stock will do tomorrow, but it can tell you whether a company is financially sound, growing, and reasonably priced — which is a far more durable basis for decision-making.
Reading Financial Statements: The Foundation of Fundamental Analysis
The three core financial statements are the income statement, the balance sheet, and the cash flow statement. Together, they tell the story of a company's financial life. Financial statement analysis tools can help you work through these more efficiently, but understanding what you're looking at is essential first.
The Income Statement
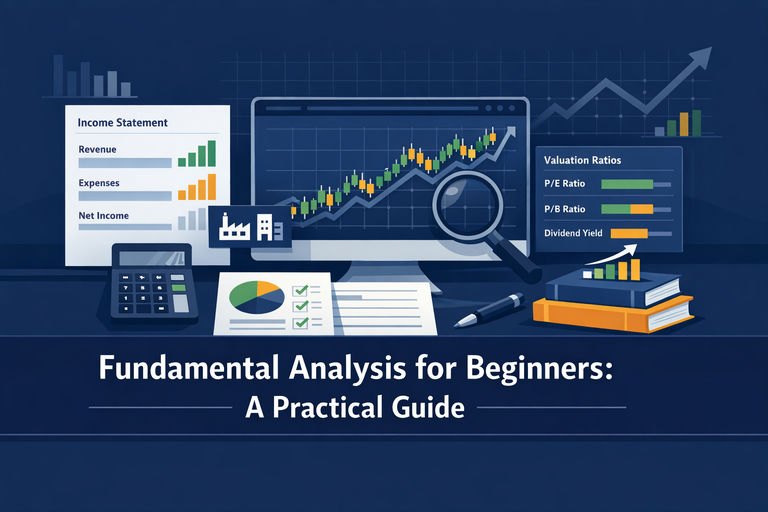
The income statement shows revenue, expenses, and profit over a given period. Key lines to focus on include:
- Revenue growth: Is the top line expanding consistently year over year?
- Gross margin: What percentage of revenue remains after the cost of goods sold? Higher margins often signal pricing power or operational efficiency.
- Operating income and net income: Are profits growing in line with revenue, or are costs eating into margins?
- Earnings per share (EPS): How much profit is attributable to each share? Watch for dilution from share issuances.
The Balance Sheet
The balance sheet is a snapshot of what a company owns (assets) and owes (liabilities) at a point in time. Key things to assess:
- Debt levels: How much long-term debt does the company carry relative to its equity and earnings?
- Current ratio: Can the company cover its short-term liabilities with its short-term assets? A ratio above 1 is generally healthy.
- Book value: The net asset value of the company, which can serve as a floor valuation in some industries.
The Cash Flow Statement
Many analysts consider free cash flow the most important metric in fundamental analysis. A company can report accounting profits while actually burning cash — the cash flow statement reveals the truth. Focus on operating cash flow and free cash flow (operating cash flow minus capital expenditure). Consistent free cash flow generation is a hallmark of a high-quality business.
Key Valuation Metrics Every Beginner Should Know
Once you understand a company's financials, the next step is assessing whether its stock is reasonably priced. Stock valuation tools and ratios help you compare a company's price to its underlying financial performance. Here are the most widely used:
Price-to-Earnings Ratio (P/E)
The P/E ratio divides the stock price by earnings per share. A P/E of 20 means investors are paying £20 (or $20) for every £1 of annual earnings. Context matters enormously here — a high P/E may be justified for a fast-growing company, while a low P/E might signal value or reflect genuine problems. Always compare P/E ratios within the same sector.
Price-to-Book Ratio (P/B)
The P/B ratio compares market price to book value per share. It's particularly useful for financial companies and asset-heavy businesses. A P/B below 1 can indicate a stock is trading below the value of its net assets — though it can also signal structural problems.
EV/EBITDA
Enterprise Value to EBITDA is a capital-structure-neutral valuation metric that many professional analysts prefer over P/E. It accounts for debt and is less susceptible to accounting distortions. It's especially useful when comparing companies with different levels of leverage.
Price-to-Free Cash Flow (P/FCF)
Dividing market capitalisation by free cash flow gives you a sense of how much you're paying for the company's actual cash-generating ability. Many value investors consider this the most reliable valuation multiple.
Dividend Yield and Payout Ratio
For income-focused investors, dividend yield (annual dividend divided by share price) and the payout ratio (dividends as a percentage of earnings) are important. A high yield is only attractive if the payout is sustainable — a payout ratio above 80–90% may signal the dividend is at risk.
Assessing Business Quality: Beyond the Numbers
Numbers tell you what has happened. Business quality analysis helps you assess what is likely to happen next. This is sometimes called qualitative fundamental analysis, and it's just as important as the quantitative side.
Competitive Moat
A competitive moat is a durable advantage that protects a company's profits from competitors. Moats can take many forms: brand strength, network effects, switching costs, cost advantages, or regulatory licences. Companies like Microsoft (MSFT) or Visa (V) are often cited as examples of businesses with wide, durable moats — though whether their current valuations reflect that is a separate question.
Management Quality
Strong management allocates capital wisely, communicates transparently with shareholders, and builds culture. Look at the track record of the executive team, their ownership stake in the business, and how they've handled past challenges. Insider ownership aligned with shareholders is generally a positive signal.
Industry Dynamics
Even a well-run company can struggle in a structurally declining industry. Assess the size and growth rate of the addressable market, the competitive landscape, and any regulatory or technological disruption risks. A company growing at 10% in a market growing at 15% may be losing ground, even if the absolute numbers look good.
Try it on live data
Do the fundamental work without the spreadsheet
Openbook pulls the ratios in this guide together into Value, Growth, Profitability and Momentum factor scores on 25,000+ companies — so you can spot candidates in minutes and then check the numbers yourself.
How to Find Undervalued Stocks Using Fundamental Analysis
Understanding how to find undervalued stocks is one of the most sought-after skills in investing — and fundamental analysis is the primary toolkit for doing it systematically. Here's a practical framework:
- Start with a screen: Use a stock screener to filter for companies with low P/E or P/FCF ratios, strong balance sheets, and consistent earnings growth. This narrows a universe of thousands down to a manageable list.
- Read the financials: For each candidate, review at least three to five years of income statements, balance sheets, and cash flow statements. Look for consistency and trend direction.
- Assess the moat: Ask whether the business has a durable competitive advantage. If competitors can easily replicate what the company does, the low valuation may be justified.
- Check the valuation: Compare the company's current multiples to its own historical averages and to sector peers. A stock trading at a discount to both its history and its peers warrants closer attention.
- Understand why it's cheap: This is the critical step. Every cheap stock is cheap for a reason. Your job is to determine whether that reason is temporary and fixable, or permanent and structural.
Platforms built around fundamental analysis tools can significantly accelerate this process by aggregating financial data, pre-calculating key ratios, and presenting multi-year trends in a single view — reducing the manual work involved in building spreadsheets from scratch.
Using Company Research Tools Effectively
The quality of your analysis is only as good as the data and company research tools you use. A robust research workflow typically combines several types of resources:
- Financial data platforms: Tools that provide structured access to income statements, balance sheets, cash flow statements, and pre-calculated ratios across multiple years. The ability to view trends at a glance — rather than hunting through individual filings — saves significant time.
- SEC/regulatory filings: Annual reports (10-K in the US, Annual Report in the UK) and quarterly filings (10-Q) are the primary source documents. Reading the management discussion and analysis (MD&A) section gives you direct insight into how leadership views the business.
- Earnings call transcripts: These reveal how management discusses challenges, competitive dynamics, and forward guidance. The tone and specificity of answers to analyst questions can be highly informative.
- Sector and peer comparison tools: Valuing a company in isolation is less meaningful than comparing it to its closest competitors. Tools that allow side-by-side ratio comparisons across a peer group are particularly valuable.
The goal is not to use every tool available, but to build a repeatable process that covers the key dimensions of financial health, valuation, and business quality — consistently, for every company you evaluate.
No card required
Make the process repeatable
A free account saves your screens and watchlists, which is the difference between doing fundamental analysis once and doing it consistently.
Conclusion: Building a Repeatable Fundamental Analysis Process
Fundamental analysis is not a formula that spits out a definitive answer. It's a structured way of thinking about businesses and their value — one that improves significantly with practice. The investors who do it well aren't necessarily smarter than everyone else; they're more disciplined and more consistent in how they apply the framework.
Start with the financials. Understand what the numbers are telling you about the business's health and trajectory. Then layer in valuation — are you paying a fair price for what you're getting? Finally, stress-test your thesis by asking what could go wrong, and whether the business has the competitive strength to navigate it.
Over time, working through this process across many companies builds pattern recognition that no single tool can replicate. The tools are there to make the process faster and more rigorous — but the thinking is yours.
Next step
Practise on a real shortlist
Screen for companies with strong profitability and a reasonable valuation, then work through the statements on five of them. That is the whole exercise.
You can Compare MSFT, V side by side on Openbook, or find stocks with the screener.
Related analysis

Co-founder of Openbook Analytics. Andrew studied Finance and Economics at the University of Strathclyde and writes on UK & US equities, stock valuation models, and portfolio strategy.
This article is for information and education only. It is not investment advice and not a recommendation to buy, sell or hold any investment. Openbook Analytics Ltd is not authorised or regulated by the Financial Conduct Authority. Past performance is not a reliable indicator of future results; the value of investments can fall as well as rise and you may get back less than you invest. Do your own research or speak to a qualified financial adviser.